Visual Studio 11 - Getting Started Part 2
Page Inspector
In the previous post, we got a quick start into Visual Studio 11
and checked out the web templates associated with Asp.Net MVC4 and some cool new
features. In this post we will look into one of the most useful and intriguing features
of Visual Studio 11 - Page Inspector.
To be honest, Page Inspector beats anything on the lines of dom-visualization as
well as server-side code visualization in the development world. According to MSDN
- "Page Inspector is a tool that renders a web page (HTML, Web Forms, ASP.NET MVC,
or Web Pages) directly within the Visual Studio IDE and lets you examine both the
source code and the resulting output. For ASP.NET pages, Page Inspector lets you
determine which server-side code has produced the HTML markup that is rendered to
the browser. Page Inspector works even when the default ASP.NET bundling and minification
features are enabled."
NOTE: I am using the Single Page Application (SPA) template to demonstrate the funcitonality of Page Inspector. If you are planning on following the code below, please go to Visual Studio 11 and create a new project with SPA template.
How to use Page Inspector:
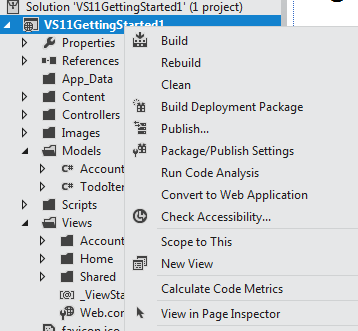
- Open Page Inspector: Right - click on your web application and select View in Page Inspector (screenshot below). Page inspector works on the current version of IE installed on your machine. In my case, I am still using IE 9 and this works for me.
- Enable Page Inspector: In order to use Page Inspector, you must enable it.
This can be done by adding the following app-setting in your web.config:
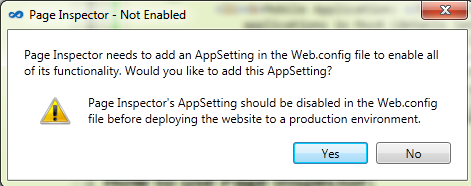
NOTE: This setting should be disabled in production for obvious reasons. If you forget to enable this setting and click 'View in Page Inspector', Visual Studio generates the following prompt (screenshot below). If you click Yes, VS 11 automatically adds this setting for you - Neat!!!!!!
- Using Page Inspector: You can start inspect the code on a page by clicking the Arrow sign. This starts the Inspect Mode. The letter '1' below in the picture depicts the sign. Once you click on the sign, you can start inspecting the dom. Note that when you hover over the elements in the dom, it shows you not only the HTML that is rendered (Letter '2' below) but also highlights the source code files.
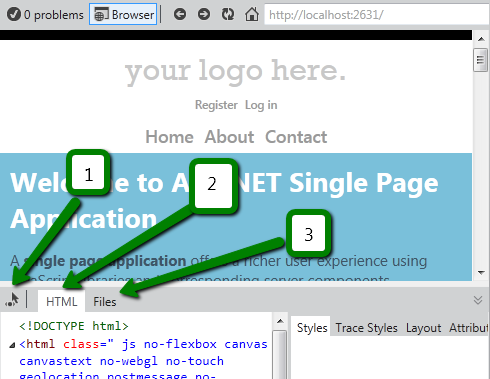
In order to see which files are responsible for the current mark up on the page, click the 'Files' tab (Letter '3' below depicts the file tab). In my case, if I click the file tab, I see three different files.
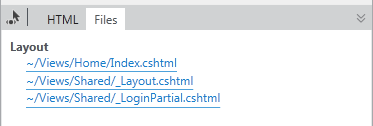
If you click on any of these links above, you will be redirected to that particular file.
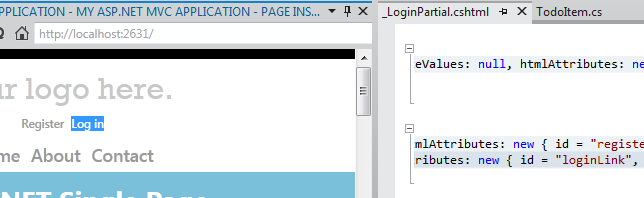
I hope you noticed in the screenshot above that hovering over Log In bring up the file _LoginPartial.cshtml and highlights the Log In attribute. This means the page inspector is smart enough to figure out that this code is coming from the partial. The code it's highlighting is server-side code written in Razor syntax. Super-cool!
Important: Some of you are wondering by now, if this works the other way round. The answer is yes, however, to make it work you will have to double click the source code. You will also have to make sure that the arrow (for page inspection) is highlighted.
HTML tab
HTML tab (Letter '2' above) shows you the mark up of the page being displayed on the browser (in this case, Page Inspector). Page Inspector is emulating the browser and all the mark up is shown in the HTML tab.
- Selection Mapping: If you click on the mark up in the HTML tab, you can see the corresponding highlighting in the navigated page. You will notice that this works even though the Inspect Modeis not on. This process is called Selection Mapping. However, this does not mean that selecting a markup in the HTML tab will highlight the code in the source files.
- HTML Editing - Styles tab: You can edit the HTML in real time and the changes will be reflected in the browser emulator view. (screenshot)
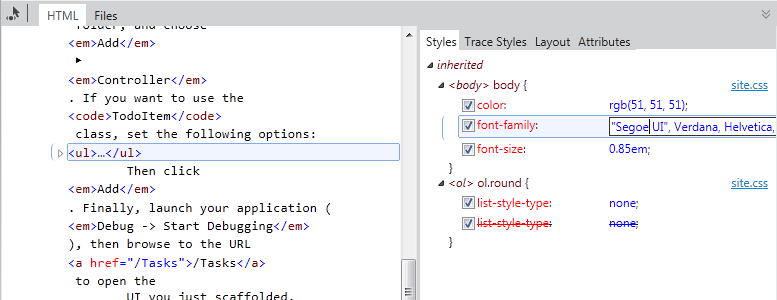
- HTML Editing - Trace Styles tab: This is the same as the Styles tab, however, it orders the styles applied to the selection by attribute name.
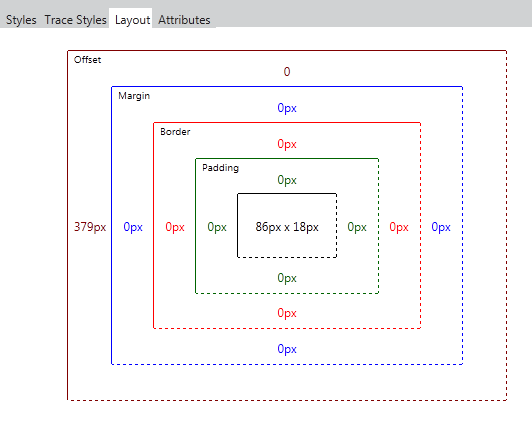
- HTML Editing - Layout tab: This tab shows the exact layout of the selected element. It tells you the offsets, margins, border and padding associated with the element.
- HTML Editing - Attributes tab: This tab allows you to add attributes to the currently selected elements. Let's take an example of an action link (screenshot).
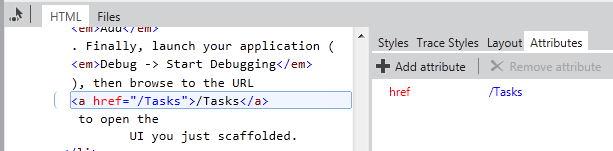
The next step would be to click Add Attribute and then add the style attribute. For simplicity, we are just going to change the color to red. (screenshot)
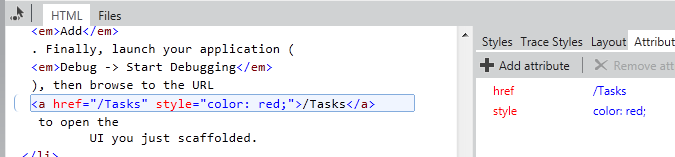
You will notice that the color of the tasks link changes to red instantly. However, this does not change the style in the actual code. This is to make sure that we have a way of making changes without having to change the code and once we like them we can add those changes in code.
Summary
Page Inspector is one of the best features in VS 11. I haven't found a need to use a browser since the installation of VS 11 which is an amazing thing for a web developer. It saves me a lot of time, helps me find both the client side and server side code in the source files. I recommend this powerful tool for improving productivity big-time. Enjoy!