Monitoring your services with SO-Aware
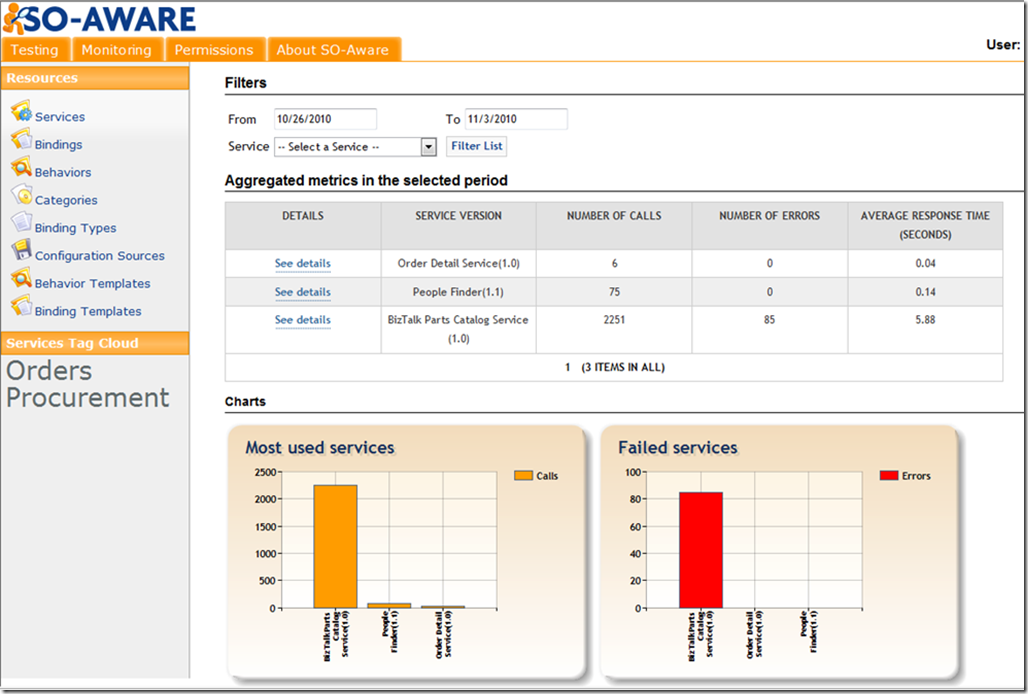
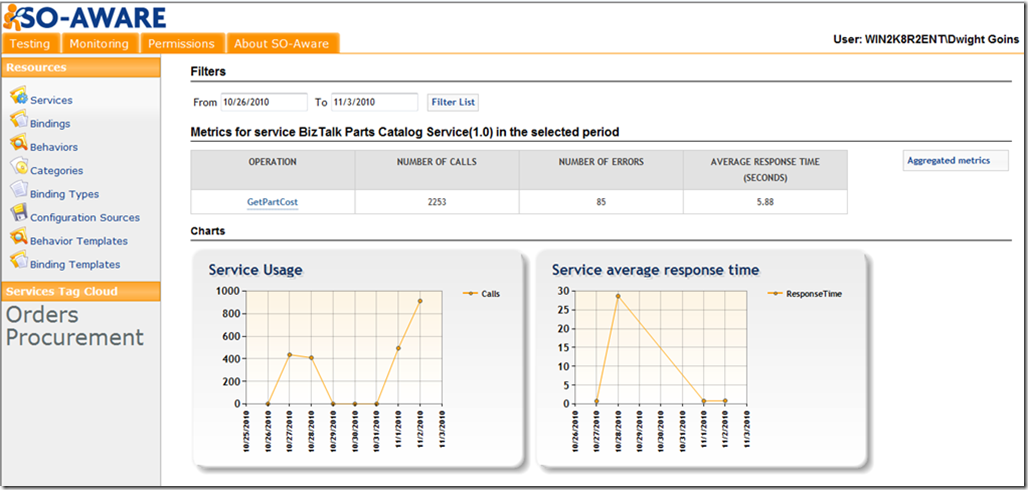
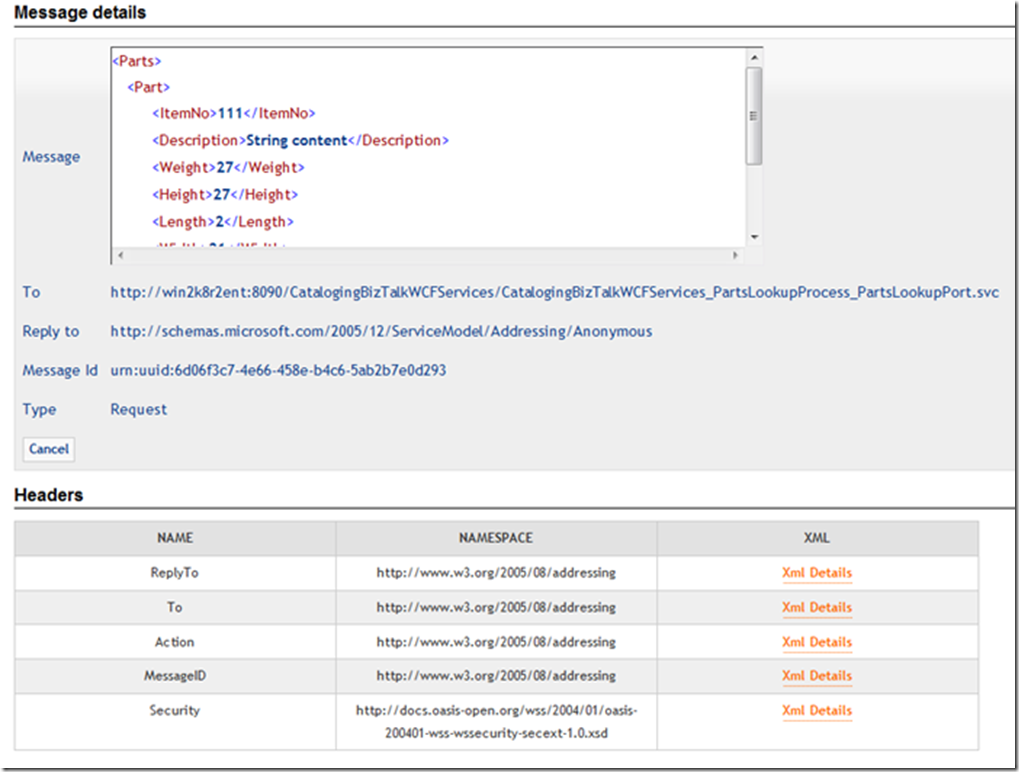
One of the features that you get out of the box with SO-Aware is the ability of monitoring your services. You can either monitoring the traffic for your REST or SOAP services, and see the details of all the incoming or outgoing messages, or any fault that got generated during the execution. In addition, that data is used to compute some metrics and provide several reports about the service usage.
The following images illustrates some of the reports provided by SO-Aware.
All the monitoring in SO-Aware is performed by a custom WCF service behavior that needs to be configured in any existing service. If you are using the service host provided by SO-Aware to automatically configure the service from the configuration in the repository, you also get monitoring for free, as that service host automatically injects the service behavior for monitoring according to the tracking profile selected for the service in the configuration page.
SO-Aware supports four different tracking profiles, InformationSoap, InformationRest, VerboseSoap and VerboseRest. Information or Verbose specifies the level of detail that you want to track for the service, and this should be chosen carefully to avoid affecting the service performance in general. Soap or Rest specifies the tracking service that you want to use. SO-Aware provides two tracking service versions by default, one SOAP implementation that uses binary encoding with tcp for better performance, and a http implementation that provides better interoperability.
An important thing to consider is that SO-Aware does not compete with Windows AppFabric in the monitoring aspect by any means, but it can be used as a good complement. The monitoring behavior in SO-Aware can be configured as an additional tracking participant in AppFabric to send more information and details about the messages to the AppFabric tracking database.


