DotNetStories

I was involved in designing and implementing an ASP.Net application some time ago. After we deployed the application we wanted to monitor various aspects of the application.
We can use the Performance Monitor. In my windows Server 2008 machine, I go to Start-Run and type "perfmon" and the Performance monitor window pops up.
There are thousands of counters in there and it is impossible for anyone to know them all.
Most people I know use the Performance Monitor to add counters to monitor SQL Server and diagnose performance problems.
Most database administrators must understand the counters (buffer cache hit ratio,average wait time e.t.c) they will use to monitor the SQLServer.
We can use ASP.Net counters. There other ways to monitor the performance. Some people use Tracing as one of their first tools to see what is going on. If they get complaints that the site has slowed down they can use tracing to have a look at the ViewState size and act accordingly.
ASP.Net performance counters are very useful for tracking many aspects of a running ASP.Net application.
When I mentioned that solution, adding ASP.Net performance counters that is, noone seemed to have done something similar in the past. They have implemented some other solutions or used third party tools.
If you are relatively new to the issue of ASP.Net performance counters have a look here
1) I am going to add some ASP.Net counters for a live asp.net website. The website is http://www.nksolutions.gr.
2) I log in to my remote windows server 2008 machine that hosts my site under IIS 7.0. You can create a local website in your machine and use the Performance monitor from your local machine.
3) In my windows Server 2008 remote machine, I go to Start-Run and type "perfmon" and the Performance monitor window pops up.
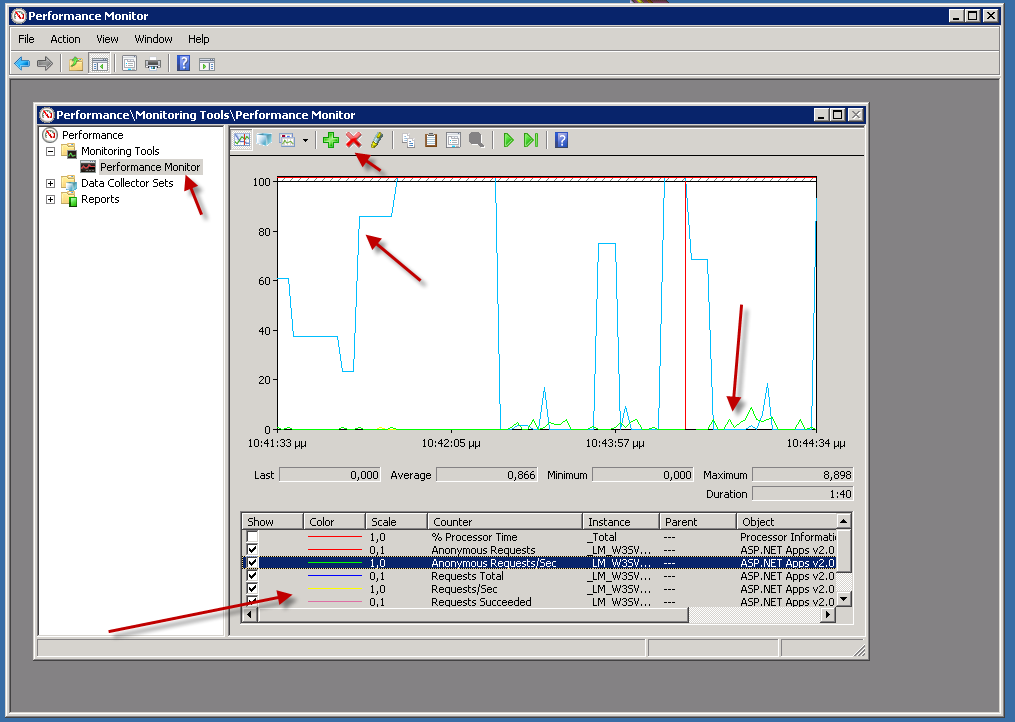
4) Then I hit "Add", the green cross icon and the Add counters window pops up. From there I am selecting, ASP.NET Apps v2.0.5027 and then I specify the counters I want to observe.
5) For this example, I have selected
You can select any counters you want.
6) I start to hit my website, browsing the various pages and at the same time I see what is going on in the performance monitor.
This is a screenshot from my example
I will be posting more ways on how to monitor the performance/health of your website.
In this post, we will not write any code. I just wanted to bring your
attention to Performance monitor and the ASP.Net performance counters
Hope it helps!!!
Comments have been disabled for this content.