
Creating a Line Chart using the HTML 5 Canvas

The HTML 5 canvas is capable of rendering lines, shapes, images, text and more without relying on a plugin. Although the canvas element isn’t supported by older browsers, the latest version of all major browsers (IE, Safari, Chrome, Firefox and Opera) now support the canvas making it an option for rendering charts, graphs and other types of visual data. In cases where a browser doesn’t support the canvas, a fallback can be provided that renders data using Silverlight, Flash or another type of plugin.
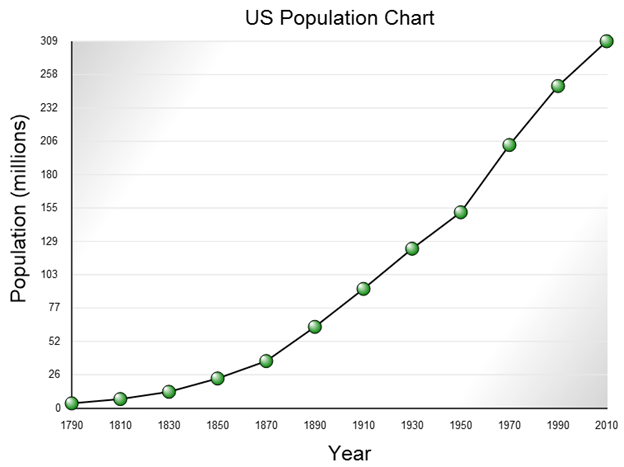
In a previous post I walked through the fundamentals of using the HTML 5 canvas to render different types of shapes. In this post I’ll discuss how the canvas can be used to render a line chart using JavaScript. An example of the chart that will be discussed is shown next:

To render the chart a JavaScript object named CanvasChart was created that handles rendering all of the lines, shapes and text shown above. An example of defining CanvasChart settings and calling its render() function is show next. The render() function accepts the canvas element ID as well as a JSON object that defines chart properties and data to be used in the rendering process.
<!DOCTYPE html>
<html>
<head>
    <title>Canvas Chart Demo</title>
    <script src="Scripts/jquery-1.6.min.js" type="text/javascript"></script>
    <script src="Scripts/canvasChart.js" type="text/javascript"></script>
    <script type="text/javascript">

        $(document).ready(function () {
            var dataDef = { title: "US Population Chart",
                            xLabel: 'Year',
                            yLabel: 'Population (millions)',
                            labelFont: '19pt Arial',
                            dataPointFont: '10pt Arial',
                            renderTypes: [CanvasChart.renderType.lines, CanvasChart.renderType.points],
                            dataPoints: [{ x: '1790', y: 3.9 },
                                         { x: '1810', y: 7.2 },
                                         { x: '1830', y: 12.8 },
                                         { x: '1850', y: 23.1 },
                                         { x: '1870', y: 36.5 },
                                         { x: '1890', y: 62.9 },
                                         { x: '1910', y: 92.2 },
                                         { x: '1930', y: 123.2 },
                                         { x: '1950', y: 151.3 },
                                         { x: '1970', y: 203.2 },
                                         { x: '1990', y: 248.7 },
                                         { x: '2010', y: 308.7}]
                           };
            CanvasChart.render('canvas', dataDef);
        });

    </script>
</head>
<body style="margin-left:50px;margin-top:50px;">
    <canvas id="canvas" width="800" height="600"></canvas>
</body>
</html>
While the CanvasChart object is only a prototype at this point, it demonstrates several key features of the canvas element that can be used in applications including rendering lines, shapes, gradients, text and even transformed text. Let’s take a look at how the CanvasChart object was created.
Rendering Gradients and Text
The code for the CanvasChart object is located in a file named canvasChart.js. The code starts by defining a CanvasChart object that exposes two members named renderType and render. renderType is used to define what will be rendered on the chart (currently it supports rendering lines and points) while render() is used to render the data on the canvas as well as the associated labels for the x and y axes. The skeleton code for CanvasObject is shown next:
var CanvasChart = function () {
    var ctx;
    var margin = { top: 40, left: 75, right: 0, bottom: 75 };
    var chartHeight, chartWidth, yMax, xMax, data;
    var maxYValue = 0;
    var ratio = 0;
    var renderType = { lines: 'lines', points: 'points' };


    return {
        renderType: renderType,
        render: render
    };
} ();
The render() function accepts the canvas ID within the page as well as a JSON object that defines details about labels, font sizes, data points and more:
var render = function(canvasId, dataObj) {
    data = dataObj;
    getMaxDataYValue();
    var canvas = document.getElementById(canvasId);
    chartHeight = canvas.attr('height');
    chartWidth = canvas.attr('width');
    xMax = chartWidth - (margin.left + margin.right);
    yMax = chartHeight - (margin.top + margin.bottom);
    ratio = yMax / maxYValue;
    ctx = canvas.getContext("2d");
    renderChart();
}
The function starts by assigning the dataObj parameter to a variable within the CanvasChart object and then calls an internal function named getMaxDataYValue(). The getMaxDataYValue() function determines the maximum Y value for the data points. From there, the render() function locates the target canvas element within the page, calculates width and height values, and accesses the canvas’s 2D context that will be used to draw. Finally, a call is made to renderChart() to start the rendering process.
The renderChart() function orchestrates different drawing functions and handles rendering the background, lines, labels and data by calling the respective functions:
var renderChart = function () {
    renderBackground();
    renderText();
    renderLinesAndLabels();

    //render data based upon type of renderType(s) that client supplies
    if (data.renderTypes == undefined || data.renderTypes == null) data.renderTypes = [renderType.lines];
    for (var i = 0; i < data.renderTypes.length; i++) {
        renderData(data.renderTypes[i]);
    }
}
Different canvas features are used such as gradients and transforms in the CanvasChart object. For example, the renderBackground() function shows how linear gradients can be created:
var renderBackground = function () {
    var lingrad = ctx.createLinearGradient(margin.left, margin.top, xMax - margin.right, yMax);
    lingrad.addColorStop(0.0, '#D4D4D4');
    lingrad.addColorStop(0.2, '#fff');
    lingrad.addColorStop(0.8, '#fff');
    lingrad.addColorStop(1, '#D4D4D4');
    ctx.fillStyle = lingrad;
    ctx.fillRect(margin.left, margin.top, xMax - margin.left, yMax - margin.top);
    ctx.fillStyle = 'black';
}
The renderBackground() function uses the 2D context’s createLinearGradient() function to define a gradient that has 4 gradient stops. Once the gradient is defined it is assigned to the fillStyle property and then rendered to a rectangular area using the fillRect() function.
CanvasChart also demonstrates how text can be manipulated using transforms. The text displayed on the Y axis is rotated so that it displays vertically:

This is accomplished by using the canvas element’s rotate transform functionality which is found in the renderText() function:
var renderText = function renderText() {
    var labelFont = (data.labelFont != null) ? data.labelFont : '20pt Arial';
    ctx.font = labelFont;
    ctx.textAlign = "center";

    //Title
    var txtSize = ctx.measureText(data.title);
    ctx.fillText(data.title, (chartWidth / 2), (margin.top / 2));

    //X-axis text
    txtSize = ctx.measureText(data.xLabel);
    ctx.fillText(data.xLabel, margin.left + (xMax / 2) - (txtSize.width / 2), yMax + (margin.bottom / 1.2));

    //Y-axis text
    ctx.save();
    ctx.rotate(-Math.PI / 2);
    ctx.font = labelFont;
    ctx.fillText(data.yLabel, (yMax / 2) * -1, margin.left / 4);
    ctx.restore();
}
The key section of this code is the call to ctx.save() (toward the bottom of the function shown above) which saves the current state of the canvas so that it can be restored. This is necessary so that the entire canvas isn’t rotated. Once the current canvas state is saved, a call to the rotate() function is made to rotate the canvas. The text is then drawn for the vertical axis using the fillText() function. Once the rotated text is rendered the canvas is restored back to its saved state (the state before the rotate transform was applied and the text was rendered).
After the x and y axis text is rendered, the CanvasChart object makes a call to renderLinesAndLabels() to handle rendering the horizontal and vertical lines.
var renderLinesAndLabels = function renderLinesAndLabels() {
    //Vertical guide lines
    var yInc = yMax / data.dataPoints.length;
    var yPos = 0;
    var yLabelInc = (maxYValue * ratio) / data.dataPoints.length;
    var xInc = getXInc();
    var xPos = margin.left;
    for (var i = 0; i < data.dataPoints.length; i++) {
        yPos += (i == 0) ? margin.top : yInc;
        //Draw horizontal lines
        drawLine(margin.left, yPos, xMax, yPos, '#E8E8E8');

        //y axis labels
        ctx.font = (data.dataPointFont != null) ? data.dataPointFont : '10pt Calibri';
        var txt = Math.round(maxYValue - ((i == 0) ? 0 : yPos / ratio));
        var txtSize = ctx.measureText(txt);
        ctx.fillText(txt, margin.left - ((txtSize.width >= 14)?txtSize.width:10) - 7, yPos + 4);

        //x axis labels
        txt = data.dataPoints[i].x;
        txtSize = ctx.measureText(txt);
        ctx.fillText(txt, xPos, yMax + (margin.bottom / 3));
        xPos += xInc;
    }

    //Vertical line
    drawLine(margin.left, margin.top, margin.left, yMax, 'black');

    //Horizontal Line
    drawLine(margin.left, yMax, xMax, yMax, 'black');
}
Lines are normally drawn using the 2D context’s moveTo() and lineTo() functions which I wrapped in a function named drawLine() to simplify the process:
var drawLine = function drawLine(startX, startY, endX, endY, strokeStyle, lineWidth) {
    if (strokeStyle != null) ctx.strokeStyle = strokeStyle;
    if (lineWidth != null) ctx.lineWidth = lineWidth;
    ctx.beginPath();
    ctx.moveTo(startX, startY);
    ctx.lineTo(endX, endY);
    ctx.stroke();
    ctx.closePath();
}
At this point the canvas looks like the following:

Rendering Data
Once the labels and lines are rendered, CanvasChart handles rendering the data points by calling a function named renderData(). This function handles iterating through the JSON data points and drawing lines, points or both depending upon the settings passed to CanvasChart’s render() function. Lines are drawn to connect the different data points through calls to the drawLine() function shown earlier while circles are drawn for specific data points by making calls to the 2D context’s arc() function. The circles that are rendered have a radial gradient applied to them using the createRadialGradient() function:
var renderData = function renderData(type) {
    var xInc = getXInc();
    var prevX, prevY = 0;

    for (var i = 0; i < data.dataPoints.length; i++) {
        var pt = data.dataPoints[i];
        var ptY = (maxYValue - pt.y) * ratio;
        if (ptY < margin.top) ptY = margin.top;
        var ptX = (i * xInc) + margin.left;

        if (i > 0 && type == renderType.lines) {
            //Draw connecting lines
            drawLine(ptX, ptY, prevX, prevY, 'black', 2);
        }

        if (type == renderType.points) {
            var radgrad = ctx.createRadialGradient(ptX, ptY, 8, ptX - 5, ptY - 5, 0);
            radgrad.addColorStop(0, 'Green');
            radgrad.addColorStop(0.9, 'White');
            ctx.beginPath();
            ctx.fillStyle = radgrad;
            //Render circle
            ctx.arc(ptX, ptY, 8, 0, 2 * Math.PI, false)
            ctx.fill();
            ctx.lineWidth = 1;
            ctx.strokeStyle = '#000';
            ctx.stroke();
            ctx.closePath();
        }

        prevX = ptX;
        prevY = ptY;
    }
}
Once the data points are rendered the chart looks like the following:
Conclusion
You can see that there’s a fair amount of JavaScript code required to use the canvas object. However, once the different API functions are understood it’s simply a process of calling the appropriate functions to render lines, text or shapes. Although the CanvasChart object shown here is only a prototype at this point, I hope it provides insight into what the HTML 5 canvas is capable of rendering and how some of the features it provides can be used.