Chart Helper in ASP.NET MVC 3 with Transparent Background

    Introduction:

          ASP.NET MVC 3 includes some new helper methods that are used for different purposes. Chart helper method is one them, which makes it very easy to create charts in ASP.NET MVC. In this article, I will show you how you can use Chart helper in ASP.NET MVC. I will also show you how to use the themes provided by ASP.NET MVC to style your charts.  Then I will show how to create a custom theme for making your chart background as transparent.


    Description:

          First of all, create a new ASP.NET MVC 3 application. Then add an action method named MyChart to your controller,


        public ActionResult MyChart()
        {
            var bytes = new Chart(width: 400, height: 200)
                .AddSeries(
                    chartType: "bar",
                    xValue: new[] { "Math", "English", "Computer", "Urdu" },
                    yValues: new[] { "60", "70", "68", "88" })
                .GetBytes("png");
            return File(bytes, "image/png");
        }


          Then add an img tag inside your view and set the src attribute to point this action method,


        <img src="@Url.Action("MyChart")" alt="SimpleChart" />


          Now run this application, you will see the following screen,


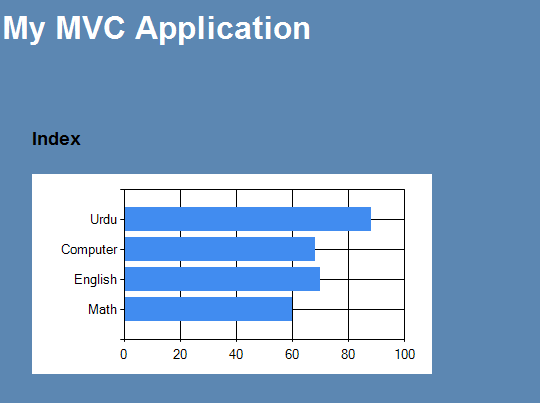
          The above screenshot shows you a chart with default theme. Now, add a Yellow theme to your chart, 


        public ActionResult MyChart()
        {
            var bytes = new Chart(width: 400, height: 200, theme:ChartTheme.Yellow)
                .AddSeries(
                    chartType: "bar",
                    xValue: new[] { "Math", "English", "Computer", "Urdu" },
                    yValues: new[] { "60", "70", "68", "88" })
                .GetBytes("png");
            return File(bytes, "image/png");
        }


          Run this application again, you will see the following screen,


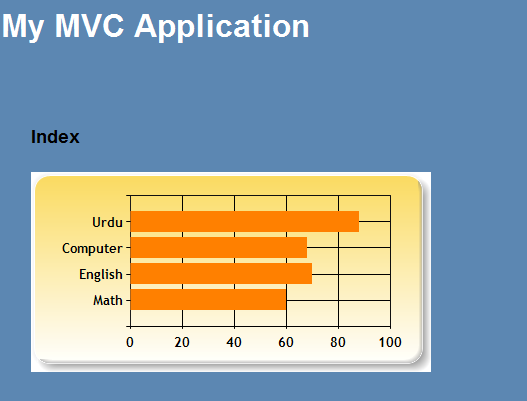
          The above screenshot shows you a chart with Yellow theme. This also shows that how easily you can change the theme of your chart. Now, let's add a custom theme which set the background color of your chart to transparent, 


        public ActionResult MyChart()
        {
            string myTheme =
                           @"<Chart BackColor=""Transparent"" >
                                            <ChartAreas>
                                                <ChartArea Name=""Default"" BackColor=""Transparent""></ChartArea>
                                            </ChartAreas>
                                        </Chart>";
            var bytes = new Chart(width: 400, height: 200, theme: myTheme)
                .AddSeries(
                    chartType: "bar",
                    xValue: new[] { "Math", "English", "Computer", "Urdu" },
                    yValues: new[] { "60", "70", "68", "88" })
                .GetBytes("png");
            return File(bytes, "image/png");
        }


          Run this application again, you will see the following screen, 


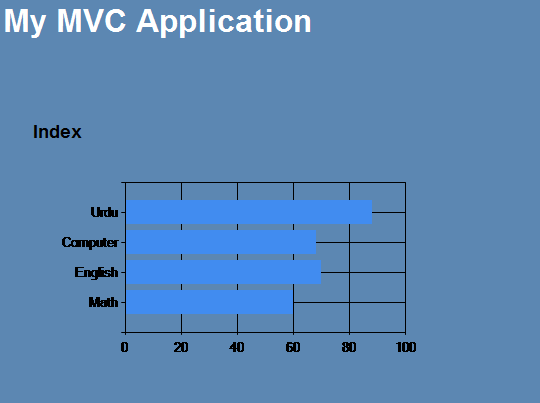
          The above screenshot shows you a chart with transparent background color. In addition to changing the background color of your chart, you can also change the gradient, border, rotation, line color, etc. Here are some themes provided by ASP.NET MVC by default, which gives you the idea how to style your charts.


    public static class ChartTheme {
        // Review: Need better names.

        public const string Blue =
@"<Chart BackColor=""#D3DFF0"" BackGradientStyle=""TopBottom"" BackSecondaryColor=""White"" BorderColor=""26, 59, 105"" BorderlineDashStyle=""Solid"" BorderWidth=""2"" Palette=""BrightPastel"">
    <ChartAreas>
        <ChartArea Name=""Default"" _Template_=""All"" BackColor=""64, 165, 191, 228"" BackGradientStyle=""TopBottom"" BackSecondaryColor=""White"" BorderColor=""64, 64, 64, 64"" BorderDashStyle=""Solid"" ShadowColor=""Transparent"" /> 
    </ChartAreas>
    <Legends>
        <Legend _Template_=""All"" BackColor=""Transparent"" Font=""Trebuchet MS, 8.25pt, style=Bold"" IsTextAutoFit=""False"" /> 
    </Legends>
    <BorderSkin SkinStyle=""Emboss"" /> 
  </Chart>";

        public const string Green =
@"<Chart BackColor=""#C9DC87"" BackGradientStyle=""TopBottom"" BorderColor=""181, 64, 1"" BorderWidth=""2"" BorderlineDashStyle=""Solid"" Palette=""BrightPastel"">
  <ChartAreas>
    <ChartArea Name=""Default"" _Template_=""All"" BackColor=""Transparent"" BackSecondaryColor=""White"" BorderColor=""64, 64, 64, 64"" BorderDashStyle=""Solid"" ShadowColor=""Transparent"">
      <AxisY LineColor=""64, 64, 64, 64"">
        <MajorGrid Interval=""Auto"" LineColor=""64, 64, 64, 64"" />
        <LabelStyle Font=""Trebuchet MS, 8.25pt, style=Bold"" />
      </AxisY>
      <AxisX LineColor=""64, 64, 64, 64"">
        <MajorGrid LineColor=""64, 64, 64, 64"" />
        <LabelStyle Font=""Trebuchet MS, 8.25pt, style=Bold"" />
      </AxisX>
      <Area3DStyle Inclination=""15"" IsClustered=""False"" IsRightAngleAxes=""False"" Perspective=""10"" Rotation=""10"" WallWidth=""0"" />
    </ChartArea>
  </ChartAreas>
  <Legends>
    <Legend _Template_=""All"" Alignment=""Center"" BackColor=""Transparent"" Docking=""Bottom"" Font=""Trebuchet MS, 8.25pt, style=Bold"" IsTextAutoFit =""False"" LegendStyle=""Row"">
    </Legend>
  </Legends>
  <BorderSkin SkinStyle=""Emboss"" />
</Chart>";

        public const string Vanilla =
@"<Chart Palette=""SemiTransparent"" BorderColor=""#000"" BorderWidth=""2"" BorderlineDashStyle=""Solid"">
<ChartAreas>
    <ChartArea _Template_=""All"" Name=""Default"">
            <AxisX>
                <MinorGrid Enabled=""False"" />
                <MajorGrid Enabled=""False"" />
            </AxisX>
            <AxisY>
                <MajorGrid Enabled=""False"" />
                <MinorGrid Enabled=""False"" />
            </AxisY>
    </ChartArea>
</ChartAreas>
</Chart>";

        public const string Vanilla3D =
@"<Chart BackColor=""#555"" BackGradientStyle=""TopBottom"" BorderColor=""181, 64, 1"" BorderWidth=""2"" BorderlineDashStyle=""Solid"" Palette=""SemiTransparent"" AntiAliasing=""All"">
    <ChartAreas>
        <ChartArea Name=""Default"" _Template_=""All"" BackColor=""Transparent"" BackSecondaryColor=""White"" BorderColor=""64, 64, 64, 64"" BorderDashStyle=""Solid"" ShadowColor=""Transparent"">
            <Area3DStyle LightStyle=""Simplistic"" Enable3D=""True"" Inclination=""30"" IsClustered=""False"" IsRightAngleAxes=""False"" Perspective=""10"" Rotation=""-30"" WallWidth=""0"" />
        </ChartArea>
    </ChartAreas>
</Chart>";

        public const string Yellow =
@"<Chart BackColor=""#FADA5E"" BackGradientStyle=""TopBottom"" BorderColor=""#B8860B"" BorderWidth=""2"" BorderlineDashStyle=""Solid"" Palette=""EarthTones"">
  <ChartAreas>
    <ChartArea Name=""Default"" _Template_=""All"" BackColor=""Transparent"" BackSecondaryColor=""White"" BorderColor=""64, 64, 64, 64"" BorderDashStyle=""Solid"" ShadowColor=""Transparent"">
      <AxisY>
        <LabelStyle Font=""Trebuchet MS, 8.25pt, style=Bold"" />
      </AxisY>
      <AxisX LineColor=""64, 64, 64, 64"">
        <LabelStyle Font=""Trebuchet MS, 8.25pt, style=Bold"" />
      </AxisX>
    </ChartArea>
  </ChartAreas>
  <Legends>
    <Legend _Template_=""All"" BackColor=""Transparent"" Docking=""Bottom"" Font=""Trebuchet MS, 8.25pt, style=Bold"" LegendStyle=""Row"">
    </Legend>
  </Legends>
  <BorderSkin SkinStyle=""Emboss"" />
</Chart>";
    }


          Note that from these chart themes, Yellow theme used in above example.  


   Summary:

          Chart helper makes it very easy to show chart in your ASP.NET MVC application. In this article, I showed you how to create a chart in ASP.NET MVC. I also showed you how to style a chart and how to change the background color of a chart. Hopefully you will enjoy this article too.  


33 Comments

  • There is a common bug when rendering png charts with transparent background which results in the UN-aliased labels shown in your screenshot. When using transparent backgrounds with the chart control, I normally set the chart's TextAntiAliasingQuality to SystemDefault. It seems to be the only fix to get better looking labels when using transparency.

  • @Greg,
    Thanks for your tip.

  • Nice post. Thanks ;)

  • nice post. I am working on chart too. but I only use mvc2.
    http://www.codeproject.com/Questions/174205/how-to-print-multi-charts-on-one-page.aspx

    I have this problem. would you look at it and teach me what's wrong?

  • @bigeyed,

    Chart Helper will also work in MVC 2 and I also used this in one MVC 2 project. You just need to reference System.Web.Helpers.dll

  • Is it possible to add a label to each bar on the chart with the exact value?

  • AFAIK, this is not supported by chart helper,
    However you can use this code to show label,(Note that you need to add reference of System.Web.DataVisualization.dll assembly)

    public ActionResult MyChart()
    {
    Bitmap image = new Bitmap(300, 50);
    Graphics g = Graphics.FromImage(image);
    System.Web.UI.DataVisualization.Charting.Chart Chart2 = new System.Web.UI.DataVisualization.Charting.Chart();

    Chart2.Width = 412;
    Chart2.Height = 296;
    Chart2.ChartAreas.Add("Series 1").BackColor = System.Drawing.Color.FromArgb(64, System.Drawing.Color.White);
    // create a couple of series
    Chart2.Series.Add("Series 1");
    Chart2.Series.Add("Series 2");
    // add points to series 1
    Chart2.Series["Series 1"].Points.AddY(10);
    Chart2.Series["Series 1"].Points.AddY(1);
    Chart2.Series["Series 1"].Points.AddY(2);
    Chart2.Series["Series 1"].Points.AddY(10);
    // add points to series 2
    Chart2.Series["Series 2"].Points.AddY(10 + 1);
    Chart2.Series["Series 2"].Points.AddY(1 + 1);
    Chart2.Series["Series 2"].Points.AddY(2 + 1);
    Chart2.Series["Series 2"].Points.AddY(10 + 1);
    Chart2.Series["Series 1"].IsValueShownAsLabel = true;
    Chart2.Series["Series 2"].IsValueShownAsLabel = true;
    Chart2.BackColor = Color.Transparent;
    MemoryStream imageStream = new MemoryStream();
    Chart2.SaveImage(imageStream, ChartImageFormat.Png);
    Chart2.TextAntiAliasingQuality = TextAntiAliasingQuality.SystemDefault;
    Response.ContentType = "image/png";
    imageStream.WriteTo(Response.OutputStream);
    g.Dispose();
    image.Dispose();
    return null;
    }

  • I'm migrating an ASP.NET WebForms site to MVC3.

    Is there also no Chart.DataManipulator when using the helper class? In WebForms, I'm using a custom data filter that implements IDataPointFilter. I essentially re-implemented KagiFilter because the built-in filter only worked when you use a single series on the chart.

    So, if I need DataManipulator, I should use System.Web.UI.DataVisualization.Charting.Chart as you posted above?

  • I'd also be curious to know how to set the *series* style/theme, as that isn't demonstrated in the default chart themes.

  • >>So, if I need DataManipulator, I should use System.Web.UI.DataVisualization.Charting.Chart as you posted above?

    Yes.

    >>I'd also be curious to know how to set the *series* style/theme, as that isn't demonstrated in the default chart themes.

    Just see Yellow, Blue, Green and Vanilla style as given above.

  • Just as a follow-up, in order to use the DataManipulator, I switched to System.Web.UI.DataVisualization.Charting.Chart.

    When I tried to write the image from the controller to the Response.OutputStream, I started getting the following error:

    "OutputStream is not available when a custom TextWriter is used."

    In researching that, I discovered that one needs to write to Response.OutputStream before the view engine replaces the output stream writer with its TextWriter. In order to do that, you're supposed to be able to create a custom action that inherits from ActionResult, and then you're supposed to be able to write to Response.OutputStream from within your override of ExecuteResult().

    When I implemented that, I still got the same error --- "OutputStream is not available when a custom TextWriter is used."

    So, I decided to write the URL of the image (text instead of binary data) to Response.OutputStream instead, and that works.

    Do you know why, even inside ExecuteResult(), I can't write the image to Response.Output stream?

    Sample code of an ActionResult that I can return in a controller by simply returning "new ChartImageResult(values)":

    public class ChartImageResult : ActionResult
    {
    protected IEnumerator Values { get; set; }

    public ChartImageResult(IEnumerator values)
    {
    Values = values;
    }

    public override void ExecuteResult(ControllerContext context)
    {
    var response = context.RequestContext.HttpContext.Response;

    using (Bitmap image = new Bitmap(800, 400))
    {
    using (Graphics g = Graphics.FromImage(image))
    {
    Chart chart = new Chart()
    {
    Width = 800,
    Height = 400,
    BackColor = Color.Gray,
    BorderlineColor = Color.Black,
    BorderlineDashStyle = ChartDashStyle.Solid,
    BorderlineWidth = 2,
    BackSecondaryColor = Color.White,
    BackGradientStyle = GradientStyle.TopBottom,
    BorderSkin = new BorderSkin() { BorderColor = Color.FromArgb(64, 64, 64, 64), SkinStyle = BorderSkinStyle.Sunken },
    TextAntiAliasingQuality = TextAntiAliasingQuality.High
    };

    ChartArea chartArea = new ChartArea("Default")
    {
    BorderColor = Color.FromArgb(64, 64, 64, 64),
    BorderDashStyle = ChartDashStyle.Solid,
    BackSecondaryColor = Color.White,
    BackColor = Color.Gray,
    ShadowColor = Color.Transparent,
    BackGradientStyle = GradientStyle.TopBottom,
    Area3DStyle = new ChartArea3DStyle() { Rotation = 10, Perspective = 10, Inclination = 15, IsRightAngleAxes = false, WallWidth = 0 },
    AxisY = new Axis()
    {
    LineColor = Color.FromArgb(64, 64, 64, 64),
    IsStartedFromZero = false,
    LabelStyle = new LabelStyle() { Font = new Font("Trebuchet MS", 8.25f, FontStyle.Bold), Format = "C" },
    MajorGrid = new Grid() { LineColor = Color.FromArgb(64, 64, 64, 64) }
    },
    AxisX = new Axis()
    {
    LineColor = Color.FromArgb(64, 64, 64, 64),
    IsStartedFromZero = false,
    LabelStyle = new LabelStyle() { Font = new Font("Trebuchet MS", 8.25f, FontStyle.Bold), Format = "d" },
    MajorGrid = new Grid() { LineColor = Color.FromArgb(64, 64, 64, 64) }
    }
    };

    Series series = new Series("Series1")
    {
    ChartArea = "Default",
    ChartType = SeriesChartType.StepLine,
    CustomProperties = "PriceUpColor=Tomato, ReversalAmount=0.01",
    Color = Color.Blue,
    BorderWidth = 4,
    IsValueShownAsLabel = true,
    LabelFormat = "C",
    BackGradientStyle = GradientStyle.TopBottom,
    ShadowColor = Color.Black,
    BorderColor = Color.FromArgb(180, 26, 59, 105),
    ShadowOffset = 2,
    Font = new Font("Trebuchet MS", 10f, FontStyle.Bold),
    MarkerStyle = MarkerStyle.Circle,
    MarkerColor = Color.SlateGray,
    XValueMember = "Timestamp",
    IsXValueIndexed = true,
    XValueType = ChartValueType.DateTime,
    YValueMembers = "Price"
    };

    chart.ChartAreas.Add(chartArea);
    chart.Series.Add(series);

    chart.DataSource = Values;
    chart.DataBind();

    // call DataBind() first for the custom filter to work properly
    chart.DataManipulator.Filter(new KagiFilter(), series);

    using (System.Web.UI.HtmlTextWriter writer = new System.Web.UI.HtmlTextWriter(new StringWriter()))
    {
    chart.ImageType = ChartImageType.Png;
    chart.SaveImage(chart.ImageLocation);
    chart.RenderControl(writer); // call RenderControl() to set CurrentImageLocation
    response.Write(chart.CurrentImageLocation);
    }
    }
    }
    }
    }

  • @Kevin
    The above code which I posted is working,
    Can you provide a sample application?

  • Hello,

    I´m working in a project with ASP.NET, framework 4, MVC 3, Razor.

    I have to do a chart. My xValue are the last 24 hours of a day ("00:00", "01:00"...).

    First I´d like to show all the 24 hours in my x axis, but i´m not able to do it. I already tried ".SetXAxis("Hour",0,24)" but nothing happens.

    Second, I´d like to change the color of the line when it pass "01:00 pm".

    As you can see on my code below, I had to force the array, I wasn´t able to do a for to do it, is it possible anyway?

    Here comes my code:

    string[] hours = new string[25]; //I fill it on a loop
    var myChart = new Chart(width: 1200, height: 400, theme: ChartTheme.Blue)
    .AddTitle("Monitor")
    .AddSeries(
    name: "Defect",
    chartType: "Spline",
    xValue: new[] { hours[0], hours[1], hours[2], hours[3], hours[4], hours[5], hours[6], hours[7], hours[8], hours[9], hours[10], hours[11], hours[12], hours[13], hours[14],hours[15], hours[16], hours[17], hours[18], hours[19], hours[20], hours[21], hours[22],hours[23], hours[24]},
    yValues: new[] { Defect[0].ToString(), Defect[1].ToString(), Defect[2].ToString(), Defect[3].ToString(), Defect[4].ToString(), Defect[5].ToString(), Defect[6].ToString(),
    Defect[7].ToString(), Defect[8].ToString(), Defect[9].ToString(), Defect[10].ToString(), Defect[11].ToString(), Defect[12].ToString(), Defect[13].ToString(), Defect[14], Defect[15].ToString(), Defect[16].ToString(), Defect[17].ToString(), Defect[18].ToString(), Defect[19].ToString(), Defect[20].ToString(), Defect[21].ToString(), Defect[22].ToString(),Defect[23].ToString(), Defect[24].ToString()}
    )

    Please help!
    Thanks in advance.

  • @Carlos,
    >>I´d like to change the color of the line when it pass "01:00 pm".
    This is not supported in Chart helper to change the color when it passes to a number.

    >>I wasn´t able to do a for to do it

    May be you need this,

    string[] hours = new string[25]; //I fill it on a loop
    for (int i = 0; i < hours.Length; i++)
    hours[i] = (i + 1).ToString().PadLeft(2,'0')+":00";
    string[] Defect = new string[25]; //I fill it on a loop
    for (int i = 0; i < Defect.Length; i++)
    Defect[i] = (i + 1).ToString();
    var myChart = new Chart(width: 1200, height: 400, theme: ChartTheme.Blue)
    .AddTitle("Monitor")
    .AddSeries(name: "Defect",chartType: "Spline",xValue: hours,yValues: Defect)
    .Write("png");
    return null;

  • Thanks for the help!

    Loop problem solved.

    But it keeps not showing the 24 hours on the x axis. It only splits to 5 hours. I´d like to show every hour!

    Talking about the color changing that is not supported, is there any other solution for it?

    Thanks again!

  • >>But it keeps not showing the 24 hours on the x axis. It only splits to 5 hours. I´d like to show every hour!

    I think in this case you need to create a custom chart like this,
    http://forums.asp.net/t/1676265.aspx/1?horizontal+bar+graph+in+mvc+3+using+razor+engine+

    >>Talking about the color changing that is not supported, is there any other solution for it?

    For changing color in certain points, you need custom charts.

  • Thanks! You´re a life saver! :)

  • Hi,
    how to add 2 or more data series on a chart?

  • One more help, how do I export the custom chart to Excel?
    Just for the recorde, I´m working in a project with ASP.NET, framework 4, MVC 3, Razor.

    Thanks in advance.

  • @Carlos,
    This is same as export image to excel. This is the one implementation,

    http://forums.asp.net/p/1456680/3340365.aspx

  • What I really need is to export the chart as image, leaving to the user to choose the location, but I just found it:

    ChartMonitoramento.SaveImage("C:\\GráficoMonitoramento.png", ChartImageFormat.Png);

    The user needs to set the location!

    Please help! Thanks!

  • @Carlos,
    Use this,

    return File(ChartURL, "application/binary", FileName);

  • Nice post, please upload a demo of them please. please

  • @dxavier
    Just copy the above action and img tag in your application.

  • Very helpful information. Thanks alot

  • Hi, how can i set interval for x axis?
    if xValues contain many data then the chart set its interval by default value and it was missing some label.
    Any idea anyone?

    Thanks b4.

  • @dejoong, See this
    http://forums.asp.net/t/1749287.aspx/1

  • Can we change the title font and size?

    I have looked in the 5 Chart themes from System.Web.Helpers.ChartTheme and was unable to find a parameter that I could use.

  • @Julian, see this sample,

    string myTheme = @"


    ";
    var bytes = new Chart(width: 1000, height: 800, theme: myTheme)
    .AddSeries(
    name: "Weight",
    chartArea: "Weight",
    xValue: new[] { 1, 2, 3, 4, 5, 6 },
    yValues: new[] { 254.5, 255, 253, 252.5, 251, 252 })
    .GetBytes("png");
    return File(bytes, "image/png");
    }

  • Error 1 The type or namespace name 'Chart' could not be found (are you missing a using directive or an assembly reference?) c:\users\jhosep\documents\visual studio 2010\Projects\MvcStartProject\MvcStartProject\Controllers\HomeController.cs 25 29 MvcStartProject

  • @jhosepdg , you are missing namespace. Try adding System.Web.Helpers namespace or directly use System.Web.Helpers.Chart

  • I got this to work nicely, but it falls out of my website's master page. I think it's because of the way the controller returns the chart bytes to the image control. I tried modifying the contoller as shown below and the image appears in the master page, but it is blank because it's not connecting to the chart image bytes. There must be a simple way to do this. What am I doing wrong?

    public ActionResult ViewChart()
    {
    var oChart = new Chart(width: 400, height: 200);
    oChart.AddSeries(chartType: "bar", xValue: new[] { "Mandarin", "English", "Spanish", "Hindi" }, yValues: new[] { "1151", "1000", "500", "490" });
    var oBytes = oChart.GetBytes("png");
    //return File(oBytes, "image/png");
    return View();
    }

  • @Steve, use Url.Action or Url.Content or ResolveUrl to connect image with controller action.

Comments have been disabled for this content.