Archives
-
How to do Custom Event Logging and Trace Writing in Azure
We’re about to begin our first “real” Azure project and I needed to wrap my head around event logging and trace writing in the cloud. Any proper application running in any cloud needs this sooner or later.
I quickly noticed that the information around Azure diagnostics was all over the place, and some things seems to have been changed in newer versions of the Azure SDK. So, something I thought was going to take me just a few minutes to figure out took about a day, but I think I got it sorted in the end and here’s what I did to get simple event logging and trace writing to work for our web role.
First thing I had to understand was how data for all kinds of diagnostics is handled and stored in Azure. You need to define which kinds of diagnostics data you want to capture, and you need to define where Azure should transfer the data captured so that you can download them or look at then with various tools. You also need to define how often these values should be transferred. I’ll get back to that a bit later.
Create a Custom Event Source
First thing I wanted to have was a custom event source to write to for warnings and errors. To do this I created a simple cmd-file which I placed inside the web role project and uploaded with the packed deployment. Now when the web role is deployed, you define startup task which runs in elevated mode (to be able to create the event source) and points to this cmd-file. So, create a file inside your project’s root called CreateEventSource.cmd and put this inside it:
EventCreate /L Application /T Information /ID 900 /SO "MySource" /D "my custom source"
NOTE! Make sure the cmd-file property for “copy to output directory” is set to “copy always” or “copy if newer”.
Then open up your service definition file, ServiceDefinition.csdef, and add a startup task to it:
<?xml version="1.0" encoding="utf-8"?>
<ServiceDefinition name="MyWeb" xmlns="http://schemas.microsoft.com/ServiceHosting/2008/10/ServiceDefinition">
  <WebRole name="MyWebRole" vmsize="ExtraSmall">
    <Startup>
      <Task commandLine="CreateEventSource.cmd" executionContext="elevated" taskType="simple" />
    </Startup>
    <Sites>
… and so on…
</ServiceDefinition>
So now when your application is deployed the cmd-file should be executed with elevated permission and create the event log source you specified. EventCreate is a tool which is available on the Azure server so it’s nothing you need to worry about. Same thing should work well on your local dev machine too.
Storage Location for Diagnostics Data
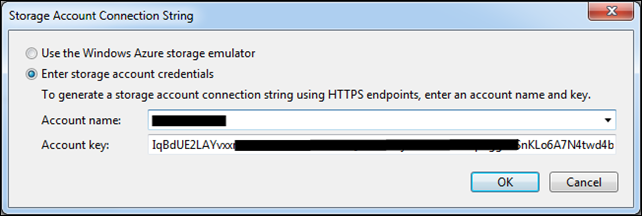
You need a place for the diagnostics data to be transferred to. This is number of Azure Storage tables so you need to create an Azure Storage Account where Azure can create these specific tables and transfer the captured data. So you basically go to the Azure Management Portal and create a new Storage Account and copy the access key. Then paste the storage account name and key into the Service Configuration:
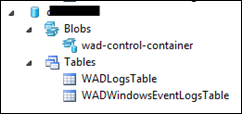
Now when Azure starts to transfer data from event log and trace writes, they will be written to these two tables; WADLogsTable and WADWindowsEventLogsTable:
If you capture performance counters and such, these will be written to other tables.
Diagnostics Configuration
Next thing to do is to configure which diagnostics to capture for your application. This is done in the OnStart() method of your WebRole.cs file. What I wanted to test initially was event logging to my custom source and also some trace writings for information, warning and errors. I also specified how frequently I wanted these diagnostics to be written to the storage tables:
public override bool OnStart()
{
    var diag = DiagnosticMonitor.GetDefaultInitialConfiguration();

    diag.Logs.ScheduledTransferLogLevelFilter = LogLevel.Information;
    diag.Logs.ScheduledTransferPeriod = TimeSpan.FromSeconds(30);

    diag.WindowsEventLog.DataSources.Add("Application!*[System[Provider[@Name='MySource']]]");
    diag.WindowsEventLog.ScheduledTransferPeriod = TimeSpan.FromSeconds(30);

    DiagnosticMonitor.Start("Microsoft.WindowsAzure.Plugins.Diagnostics.ConnectionString", diag);

    return base.OnStart();
}
Note a few things about this code – The transfer schedule is set to 30 seconds and you may want to set this one a bit higher and also look at the buffer quotas. The sample code is also only capturing and transferring event logs from the “Application” logs, and I’ve added an xpath expression to only transfer logs from the “MySource” event source we specified in the cmd-file earlier. You may want to grab all application events as well as all system logs too, in that case:
diag.WindowsEventLog.DataSources.Add("System!*");
diag.WindowsEventLog.DataSources.Add("Application!*");
Writing to Event and Trace Logs
The simplest thing is then to add some code to write to the event log and trace logs in your code, for example:
Trace.TraceError("Invalid login");
EventLog.WriteEntry("MySource","Invalid login",EventLogEntryType.Error);
Looking at the Data
To actually see what’s been written to these tables, you need to either download the data from the storage tables via APIs, use the server explorer or some tool, like the one from Cerebrata – “Azure Diagnostics Manager” – which seems to do the job pretty well. As far as I know, there is no proper tool available from Microsoft. Be that as it may.
Please, feel free to write comments below and add tips and tricks about handling diagnostics in your Azure application. I’d like to know more about the Transfer Period and Buffer Quotas and how they may affect the application and maybe also the billing… I’m sure there are loads to learn about this
 .
. -
How to Force Comments When Doing Check-In in TFS
I was looking for a policy like this, and found this blog article by Claus Konrad:
http://blog.clauskonrad.net/2010/08/tfs-2010-how-to-force-comments-when.html
Now, unfortunately everyone in the project has to have the TFS Power Tools installed to make this work.
The power tools can be downloaded from the Visual Studio Gallery, this is a direct link to it:
http://visualstudiogallery.msdn.microsoft.com/c255a1e4-04ba-4f68-8f4e-cd473d6b971f?SRC=VSIDE
Whish this was in the box from start.
-
MSTest and Calling Exe with Sample Data Files
For various reasons I’m using MSTest for my unit tests and I have this console app which generates a PDF file from an XML file that needed some tests.
So, when moving the unit tests over to a TFS build server, having hard coded paths to test data files is not a good idea. The recommended way of doing it is to use the DeploymentItem attribute.
Also, when calling an exe-file which does Environment.Exit() and catching the exit code from the unit test is pretty straight forward by using Process.Start() and checking the ExitCode property.
A small sample:
[TestMethod]
[DeploymentItem(@"TestData\arbetsorder.xml", "TestData")]
[DeploymentItem(@"TestData\arbetsorderReport.rdlc", "TestData")]
public void GeneratorShouldReturnWithExitCode0()
{
    Process proc;
    try
    {
        proc = Process.Start("PdfGenerator.exe", "\"" + Directory.GetCurrentDirectory() + "/TestData/arbetsorderReport.rdlc\" \"" +
            Directory.GetCurrentDirectory() + "/arbetsorder.pdf\" \"" + Directory.GetCurrentDirectory() + "/TestData/arbetsorder.xml\"");
    }
    catch (System.ComponentModel.Win32Exception ex)
    {
        proc = null;
        Assert.Fail(ex.Message);
    }

    Assert.IsNotNull(proc);
    proc.WaitForExit(10000);
    Assert.IsTrue(proc.HasExited);
    Assert.AreEqual(0, proc.ExitCode, "Expected 0, got " + proc.ExitCode);
}
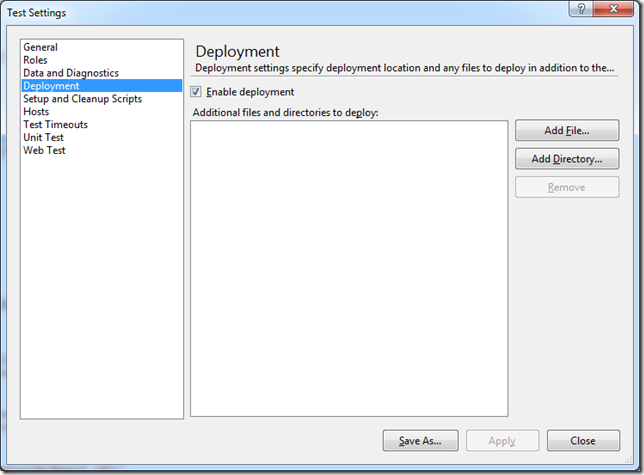
But, there’s a small caveat to get the DeploymentItem argument working properly! First you have to open up the test settings of your .testsettings file, select the Deployment settings and make sure the “Enable deployment” checkbox is checked:
That’s all you need to do. And note that you may actually have to exit and restart Visual Studio to make it work. I never got the files deployed until I did that restart.


