Publish Server Performance Monitors with MsChart
In this article I'll try to show you how to to use MsChart Controls with ajax update panel to publish your server performance counter variables.
Be sure to install these packages before your start;
MsChart Controls are free and new, I used to use owc 11 and later versions to achieve needed works on projects.
After you install these packages goon and create a new website in your visual studio. On vs2008 toolbox you’ll find some new controls which installed with MsChart package. You’ll find chart control under data tab. First add a ajax script manager and an update panel to your page. Inside the update panel drop a timer and set its interval to 3000 milliseconds (3 seconds). Drag and drop a chart control for toolbox to your update panel content section. You will have a chart section looks like below;
<asp:Chart ID="Chart2" runat="server">
<Series>
<asp:Series Name="Series1">
</asp:Series>
</Series>
<ChartAreas>
<asp:ChartArea Name="ChartArea1">
</asp:ChartArea>
</ChartAreas>
</asp:Chart>
Here you can see that the chart control have got to main section Series and ChartArea, I’ll not discus these two section widely; you may have more information about chart control and its section from Microsoft Chart Controls for .NET Framework Documentation. the series section is related with graph it self and the chartarea section is related with chart area that will hold hold the drawn graph. In my project I configured chart section as below;
<asp:Chart ID="Chart1" runat="server" Height="592px" Width="412px"
ImageUrl="~/TempImages/ChartPic_#SEQ(300,3)"
BackColor="#D3DFF0" BorderLineStyle="Solid"
BackGradientEndColor="White" BackGradientType="TopBottom"
BorderlineColor="DarkGray" EnableViewState="true"
BackImageTransparentColor="White"
BackSecondaryColor="White" BorderlineDashStyle="Solid">
Do not change ImageUrl location!.
for Series;
<Series>
<asp:Series Name="MySeries" XValueType="Double" ChartType="Spline"
BorderColor="180, 26, 59, 105"
YValueType="Double" BorderWidth="2"
ShadowColor="254, 0, 0, 0"
ShadowOffset="1"
ChartArea="MyChartArea">
<Points>
<asp:DataPoint XValue="0" YValues="0" />
</Points>
</asp:Series>
<asp:Series XValueType="Double"
Name="Exceps Thrown"
ChartType="Spline"
BorderColor="180, 26, 59, 105"
YValueType="Double"
BorderWidth="2"
ShadowColor="254, 0, 0, 0" ShadowOffset="1"
ChartArea="Default" IsVisibleInLegend="true">
<Points>
<asp:DataPoint XValue="0" YValues="0" />
</Points>
</asp:Series>
</Series>
Here I used 2 series which mean that I’ll have to graphs in my chart. You can see that I used two different chartareas that is because I’ll use two chart areas on the same chart control.There many charttypes that you can select depending on your project demands, in my example it choose Spline. Beside that I added a Points section which will give the graph a starting position ( in static chart and charts with out code behind you can add many datapoints to draw the graph needed).
and for Chart Area;
<ChartAreas>
<asp:ChartArea Name="Default" BorderColor="64, 64, 64, 64"
BorderDashStyle="Solid"
     BackSecondaryColor="White" BackColor="64, 165, 191, 228"
ShadowColor="Transparent"
     BackGradientStyle="TopBottom" Area3DStyle-Enable3D="true"
Area3DStyle-PointDepth="1000"
Area3DStyle-PointGapDepth="200" AlignmentOrientation="Horizontal">
<Position Y="5" Height="50" Width="94" X="0"></Position>
<AxisY LineColor="64, 64, 64, 64">
<MajorGrid LineColor="64, 64, 64, 64"></MajorGrid>
               <LabelStyle Font="Trebuchet MS, 8.25pt, style=Bold">
                  </LabelStyle>
</AxisY>
                            <AxisX LineColor="64, 64, 64, 64"
IsMarginVisible="False" Maximum="100" Minimum="0"
IsStartedFromZero="False">
                                <MajorGrid LineColor="64, 64, 64, 64">
</MajorGrid>
                                <LabelStyle Font="Trebuchet MS, 8.25pt,
style=Bold"></LabelStyle>
</AxisX>
</asp:ChartArea>
   <asp:ChartArea Name="MyChartArea" BorderColor="64, 64, 64, 64"
BorderDashStyle="Solid"
       BackSecondaryColor="White" BackColor="64, 165, 191, 228"
ShadowColor="Transparent"
       BackGradientStyle="TopBottom" Area3DStyle-Enable3D="true"
Area3DStyle-PointDepth="1000"
Area3DStyle-PointGapDepth="200" AlignmentOrientation="Horizontal">
<Position Y="50" Height="45" Width="94" X="0"></Position>
                 <Area3DStyle Enable3D="true" PointDepth="1000"
 PointGapDepth="200" />
<AxisY LineColor="64, 64, 64, 64">
<MajorGrid LineColor="64, 64, 64, 64"></MajorGrid>
                                <LabelStyle Font="Trebuchet MS, 8.25pt,
style=Bold"></LabelStyle>
</AxisY>
                            <AxisX LineColor="64, 64, 64, 64"
IsMarginVisible="False" Maximum="100" Minimum="0"
IsStartedFromZero="False">
                                <MajorGrid LineColor="64, 64, 64, 64">
</MajorGrid>
                                <LabelStyle Font="Trebuchet MS, 8.25pt,
style=Bold"></LabelStyle>
</AxisX>
</asp:ChartArea>
</ChartAreas>
Points of intrest in ChartAreas are Position, AxisX and AxisY section. In position section you give the locations of your chartarea over the chart control it self. Since I have two chartareas I replaced them under each other. AxisX and AxisY are used to configure your graph axes; even if you don’t configure this section you can still use your chart but you’ll have some graphical problems until you data is sent to chart and display start. after all that configuration the chart control will look as below ( you may download the project from the link in the bottom of the article )
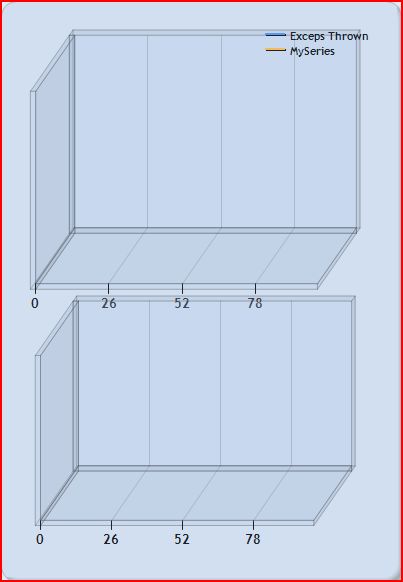
Now let us go to code behind and see how to send our performance monitors values to chart.
on Timer tick event I replaced 2 methods; the first one will set the performance monitors and the other will fill the chart as below;
(Do not forget to add using System.Web.UI.DataVisualization as a reference)
1: protected void Unnamed1_Tick(object sender, EventArgs e)
2: {
3: StartMonitor();
4: ChartCondfig();
5: }
for StartMonitor method;
private void StartMonitor()
{
   pc1 = new PerformanceCounter(".NET CLR Exceptions", "# of Exceps Thrown",
         "_Global_");
// get the current value
float dResult1 = pc1.NextValue();
pc2 = new PerformanceCounter("ASP.NET", "Application Restarts", "");
float dResult2 = pc2.NextValue();
pc3 = new PerformanceCounter("ASP.NET", "Requests Current", "");
float dResult3 = pc3.NextValue();
pc4 = new PerformanceCounter("ASP.NET", "Requests Queued", "");
float dResult4 = pc4.NextValue();
pc5 = new PerformanceCounter("ASP.NET", "Worker Process Restarts", "");
float dResult5 = pc5.NextValue();
pc6 = new PerformanceCounter("ASP.NET", "Request Execution Time", "");
float dResult6 = pc6.NextValue();
pc10 = new PerformanceCounter("Memory", "Available MBytes", "");
float dResult10 = pc10.NextValue();
}
Here pc1 – 10 are declared on page load. and you can add much performance counter as you want. In this example I selected pc1 and 10 to be shown in the graph.
For ChartCondfig method; (sorry the code is not well formatted)
1: private void ChartCondfig()
2: {
3: double lastXValue =
   4:           this.Chart1.Series[0].Points[this.Chart1.Series[0]
                  .Points.Count - 1].XValue + 1;
   5:              this.Chart1.Series[0].Points.AddXY(lastXValue++,
                  Convert.ToDouble(pc1.NextValue()));
6:
   7:              double lastXValue1 = this.Chart1.Series["MySeries"]
       .Points[this.Chart1.Series["MySeries"].Points.Count - 1].XValue + 1;
   8:              this.Chart1.Series[1].Points.AddXY(lastXValue1++,
          Convert.ToDouble(pc10.NextValue()));
9:
10: // Adjust categorical scale
  11:              double axisMinimum = this.Chart1.Series[0]
                 .Points[0].XValue;
12: this.Chart1.ChartAreas[0].AxisX.Minimum = axisMinimum;
  13:              this.Chart1.ChartAreas[0].AxisX.Maximum =
                                         axisMinimum + 100;
14:
15: this.Chart1.ChartAreas[1].AxisX.Minimum = axisMinimum;
  16:              this.Chart1.ChartAreas[1].AxisX.Maximum =
                                                 axisMinimum + 100;
17:
  18:              // Remove points from the left chart side if number of
                   points exceeds 100.
19: while (this.Chart1.Series[0].Points.Count > 100)
20: {
21: // Remove series points
22: foreach (Series series in this.Chart1.Series)
23: {
24: series.Points.RemoveAt(0);
25: }
26: }
27: }
on line 3 a double value named lastXvalue is declared this variable will hold the last point position over the X axes. on line 5 our first series on the chart will add a new point on X axes and Y axes.For X axes ,increasing lastXvalue variable will be enough and for Y axes point performance monitor current value is given.
   5:  this.Chart1.Series[0].Points.AddXY(lastXValue++,
       Convert.ToDouble(pc1.NextValue()));
Adjusting the categorical scale of the chartarea is important; otherwise win your lastXValue reaches the end of the scale you’ll have a problem, there for on line 16 we tell the chart to extend the scale. From line 19 to 26 I removed the points from series after the left side of the chart exceeds 100.
If you are debugging your project you well receive no exception but on runtime a small exception will rise; your application will look for a folder named TempImageFiles; goon and create this folder on the location shown in the exception and your application will run.
When you run the project you’ll have your chart as below;
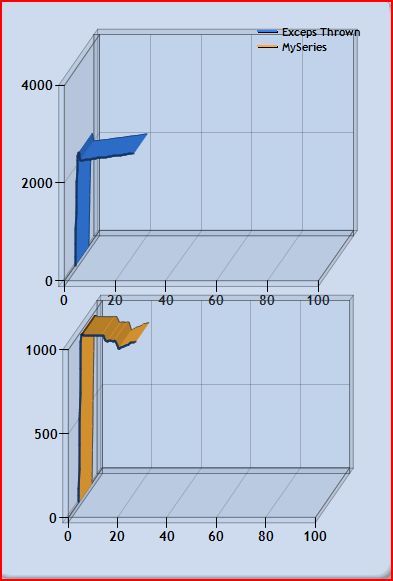
To make with example work on your server and other computers you need to install the Download the free Microsoft Chart Controls package.
That's all. In this article I tried to explain how to use MsChart to publish you server performance monitoring values. You can change and play around with charttypes and do many other nice works with that.
Download the sample project from here
For more information about MsChart you can check these links;
- Download the free Microsoft Chart Controls
- Download the VS 2008 Tool Support for the Chart Controls
- Download the Microsoft Chart Controls Samples
- Download the Microsoft Chart Controls Documentation
- Visit the Microsoft Chart Control Forum
This article is based on Microsoft Chart Controls Web Samples project ajax section.