Code instrumentation with TraceSource - My personal vade mecum
When writing more complex code you cannot really step through during debugging, it´s helpful to put stud it with statements tracing the execution flow. The .NET Framework provides for this purpose the System.Diagnostics namespace. But whenever I just quickly wanted to use it, it turned out to be a hassle to get the tracing running properly. That´s why I wrote down the following, to make it easier next time.
How to instrument the code?
In the code set up different System.Diagnostics.TraceSource objects. For each area to watch define a trace source name, e.g. "BusinessLogic" or "Validation" or "TextFileAdapter". Each such trace source later can be switched on/off separatedly.
using System.Diagnostics;
...
TraceSource ts;
ts = new TraceSource("HelloWorld", SourceLevels.All);
A TraceSource object can be instantiated for just one method or can be kept around for a long time as a global (or even static) reference.
To trace the execution use one of the TraceXYZ() methods of TraceSource. Most of the times one of the following will do. TraceInformation() writes an informational message, i.e. with TraceEventType Information:
ts.TraceInformation("# of records processed: {0}", n);
That´s the same as this:
ts.TraceEvent(TraceEventType.Information, 10, "# of records processed: {0}", n);
But TraceEvent() can do more. With it you can issue message on different levels, e.g. just informational messages, warnings, error messages. The id (10 above) will show up in the event log in its own column ("Event").
Since tracing can sometimes produce an overwhelming amount of messages, you can filter them. For example you can restrict the output of messages to errors only. But you should not do so in your code. That´s why you should pass SourceLevels.All to the TraceSource ctor. (Without setting a source level explicitly, the default is Off, so you´d see no messages at all!)
However, if you want to limit the tracing imperatively to certain levels of messages, you can do so by passing a combination of levels to the ctor, e.g.
ts = new TraceSource("HelloWorld", SourceLevels.Critical | SourceLevels.ActivityTracing);
How to attach tracing to different message sinks?
Tracing messages are written to any sink attached to the tracing infrastructure. A sink can be a text file or the console or an event log. Each sink is represented by a TraceListener object. A trace source can have any number of listeners listening for messages and write them to its sink.
Listeners can be attached to trace sources imperatively in your code - or using the App.Config. I prefer the App.Config, because it allows to you add and remove listeners without touching your code.
But as long as you´re satisfied with tracing messages being sent to the debug output window of VS.NET, you don´t need an App.Config at all. There is a default listener attached to each trace source.
If you want to direct the message to other sinks, though, or filter them, then you need to tweak the App.Config. Here is the most simple trace source defined in the App.Config - but its sink still is the debug output.
<configuration>
<system.diagnostics>
<sources>
<source name="HelloWorld">
</source>
</sources>
</system.diagnostics>
</configuration>
The name needs to match the name passed to a TraceSource object in your code.
Now, you can add listeners to this source element to have the source´s tracing messages sent to different sinks:
<source name="HelloWorld">
<listeners>
<add name="consoleListener"
type="System.Diagnostics.ConsoleTraceListener">
</add>
</listeners>
</source>
This listener´s sink is the console window. By adding it to the source all tracing messages are sent to the console window - plus the debug output window. The default listener is still attached to the source. If you want messages to go to just the sinks you define, remove the default listener:
<source name="HelloWorld">
<listeners>
<remove name="Default"/>
<add name="consoleListener"
type="System.Diagnostics.ConsoleTraceListener">
</add>
</listeners>
</source>
Now you can add any number and kind of TraceListener object as within your reach. Here are the ones provided by the .NET Framework:
<system.diagnostics>
<sources>
<source name="HelloWorld">
<listeners>
<remove name="Default"/>
<add name="consoleListener"
type="System.Diagnostics.ConsoleTraceListener"/>
<add name="eventlogListener"
type="System.Diagnostics.EventLogTraceListener"
initializeData="Application"/>
<add name="textfileListener"
type="System.Diagnostics.TextWriterTraceListener"
initializeData="helloworld.log" />
<add name="xmlfileListener"
type="System.Diagnostics.XmlWriterTraceListener"
initializeData="helloworld.xml" />
<add name="defaultListener"
type="System.Diagnostics.DefaultTraceListener"/>
</listeners>
</source>
</sources>
</system.diagnostics>
What the sinks of the listeners are, should be pretty obvious from their names. The DefaultTraceListener is the one writing to debug output, though.
Three of the listeners need to be primed with additional data specifying the message sink. Pass a filename to the XmlWriterTraceListener and the TextWriterTraceListener. Pass an event log name to the EventLogTraceListener. Use the attribute initializeData for these parameters.
Please note: The TextWriterTraceListener works best, if you set the autoflush attribute of the <Trace/> element to true:
<system.diagnostics>
<trace autoflush="true"/>
Otherwise the log file might be empty, because the listener did not get properly closed. autoflush lets the trace source call Flush() on all listeners after each message, so no messages get lost.
How to share listeners between sources?
Adding a listener to a source by putting its definition into the source is a bit cumbersome, if you have several sources and want to use the same listener in all of them. But there´s a simpler way. Define a shared listener and reference it in the <add/> element.
<system.diagnostics>
<sources>
<source name="HelloWorld">
<listeners>
<remove name="Default"/>
<add name="textfileListener"/>
</listeners>
</source>
<source name="GoodBye">
<listeners>
<remove name="Default"/>
<add name="textfileListener"/>
</listeners>
</source>
</sources>
<sharedListeners>
<add name="textfileListener"
type="System.Diagnostics.TextWriterTraceListener"
initializeData="helloworld.log" />
</sharedListeners>
</system.diagnostics>
If you want to (temporarily) limit a (shared) sink to the messages from just one source, then you can set up a filter in the listener´s definition:
<sharedListeners>
<add name="textfileListener"
type="System.Diagnostics.TextWriterTraceListener"
initializeData="helloworld.log">
<filter type="System.Diagnostics.SourceFilter"
initializeData="GoodBye"/>
</add>
</sharedListeners>
Just name the only source the listener should listen to.
How to limit tracing to certain message levels?
The number of messages produced by instrumented code can be huge sometimes. So what you want to do pretty often is, filter the messages according to some criteria. The tracing API lets you do that quite easily for the trace level of the messages.
As was shown above regarding the TraceSource ctor and TraceEvent() method, each message belongs to a trace message level or category. To block messages belonging to certain levels you can do two things: set up a switch or set up a filter.
The switch switches on/off a source according to the message level. That´s most simple by using the switchValue attribute of the <source/> element:
<source name="HelloWorld" switchValue="Warning">
<listeners>
<remove name="Default"/>
<add name="consoleListener"
type="System.Diagnostics.ConsoleTraceListener">
</add>
</listeners>
</source>
Enter any of the SourceLevels enum names shown in the following table:
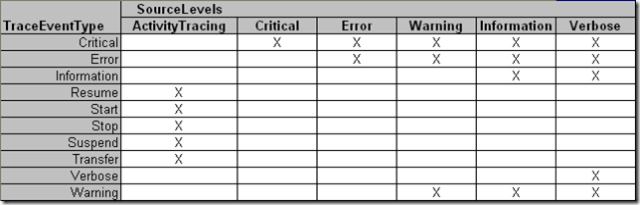
The correspond to the SourceLevels parameter of the TraceSource ctor. The table shows which trace message levels are let through or are blocked by each switch value.
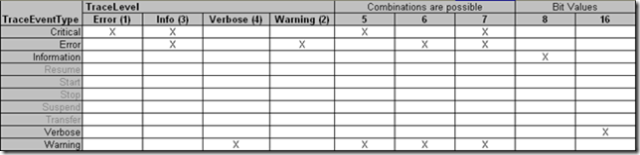
Alternatively use the TraceLevel integer values shown in the following table:
If you want to share switches among several sources, you can set up a switch definition and reference it:
<system.diagnostics>
<switches>
<add name="mySwitch" value="Information"/>
</switches>
<sources>
<source name="HelloWorld" switchName="mySwitch">
...
</source>
<source name="GoodBye" switchName="mySwitch">
...
</source>
Now, what if you want to send some messages to a certain sink and others to another sink? For exeample you want to separate error messages from informational messages? Then you use filters on listeners again:
<add name="consoleListener"
type="System.Diagnostics.ConsoleTraceListener">
<filter type="System.Diagnostics.EventTypeFilter"
initializeData="Critical"/>
</add>
Pass to an EventTypeFilter a SourceLevels enum name and it will listen only for messages on that level.
That´s pretty much it to get code basically instrumented:
- Use several trace sources to be able to switch on/off tracing for different parts of your code independently.
- Choose trace listeners to direct messages where you can easily analyse the execution flow.
- Choose switches and filters to limit the messages written to the sinks so you are not burried under a pile of irrelevant details.