Debugging Linq To Sql
I've decided that the LinqDataSource is my favorite datasource to use these days, because it allows me to consume my LinqToSql classes. My fondness of Linq to Sql also leads towards frustration when I try to figure out what's going on behind the scenes.
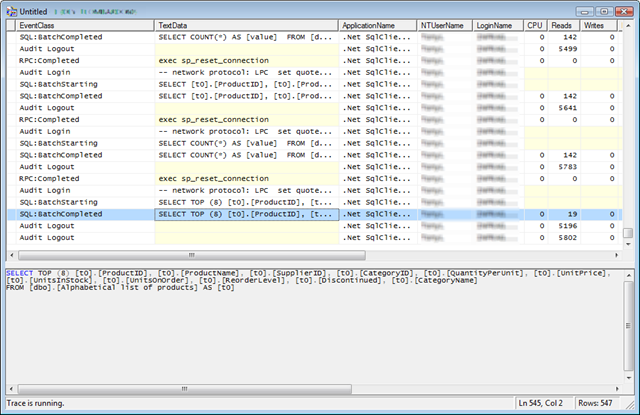
One method for debugging is to use Sql Profiler to see exactly what the sql server was asked to do. This is a great starting point, because you can see exactly how your application interfaces with your database server. It could be an eye opening experience. In my case, it showed me that there was a select statement being done which asked for all rows in my table (hence the performance problem I was trying to understand)
Here's what a typical profile session will look like:
After staring at the Sql Profiler, I still needed more information. Why was a select being done on my entire database? Where was this coming from? That led me back to my DataContext which was generated from my Linq To Sql designer. The DataContext has a great feature - "Log". It's a property right off of the context which accepts a TextWriter. When you attach a TextWriter, it will output useful information to the stream. In my case, I attached the log to the Debug window. I found some great examples of how to do this (and use other output mechanisms) on DamienGuard's blog
I modified his example slightly to attach the Log writer in the OnCreated partial method for my datacontext. This again is one of my favorite things about Linq To Sql - everything is a partial class.
The DataContext.Log gives you the exact Sql Query, which is certainly useful, but it still doesn't help me track down where that query originated from. So I turned to my DebugTextWriter one more time, and in the TextWriter.Write implementation, I added a StackTrace. Now I could see the Sql Query followed by the StackTrace which forced that Query. The code needs some tweaking, since the TextWriter.Write command could be used to simply output a /r/n or even a space, and I don't think we need to generate a callstack just for that.. but this still gives you more than you had to start with. The code below can be dropped into your project. Just change the Northwind_SimpleDataContext class name to match your DataContext.
public partial class Northwind_SimpleDataContext
{partial void OnCreated()
{
this.Log = new DebugTextWriter();
}
class DebugTextWriter : System.IO.TextWriter
{
public override void Write(char[] buffer, int index, int count)
{
System.Diagnostics.Debug.Write(new String(buffer, index, count));
StackTrace trace = new StackTrace(true);
System.Diagnostics.Debug.Write(trace.ToString());
}public override void Write(string value)
{
System.Diagnostics.Debug.Write(value);
}public override Encoding Encoding
{
get { return System.Text.Encoding.Default; }
}
}}
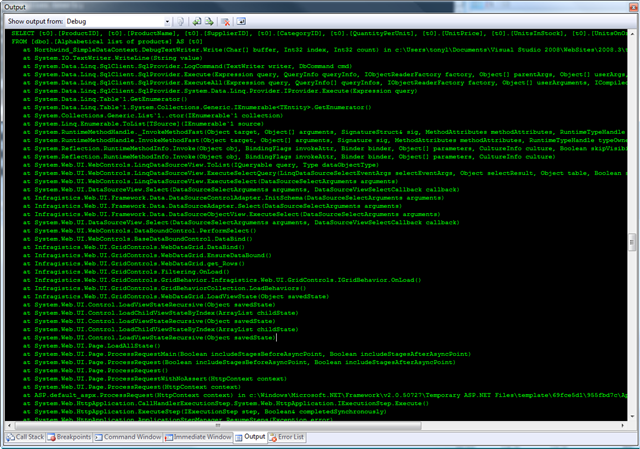
Above - An example of the Debug Output from the DataContext.Log when using the custom DebugTextWriter above.