How To Use Profiler with Linq To SQL Queries
SQL Profiler is one of the very good tools from SQL server products tools that can help you evaluate the kind of SQL statements Linq to SQL is sending to the database. Although datacontext provides you with a log property that allows you to output the SQL statement that gets send to the database, SQL Profiler is other option that helps you understand and see the SQL statements that gets executed.
In the past the problem that I faced when profiling Linq to SQL queries is there were too many things getting logged which defeats the purpose when all you care to look is at the SQL statement. So basically the key idea is to use the right filter so that you can cleanly see the queries that you are looking for. Here is the screen shot that shows you the appropriate filter that you can set to only see the dynamic SQL statements that gets sent to the database.
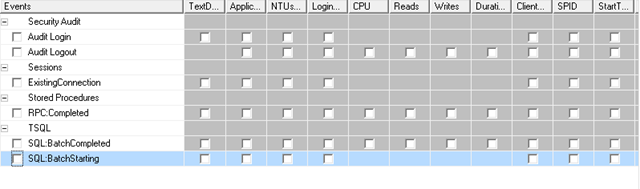
When you create a new trace in profiler, go to the Event Selection tab and uncheck all the events as shown below.
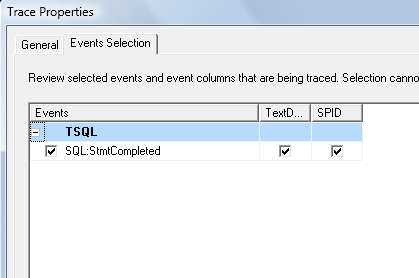
Then select show all events and find the event which says SQL:StmtCompleted and check the column of TextData to be display for that category. The final figure would look something like this.
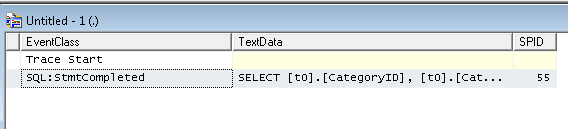
The above screen shot shows a sample SQL captured from Linq to SQL execution.