Troubleshooting your WCF Web Apis with AppFabric
In this last post, I showed how the new WCF Web Apis could be integrated with AppFabric for pushing custom events to the AppFabric tracking database. A great thing about the monitoring infrastructure in AppFabric is that is uses ETW as mechanism for publishing the events, so your services are not hitting the database directly with all the performance penalties that database calls imply.
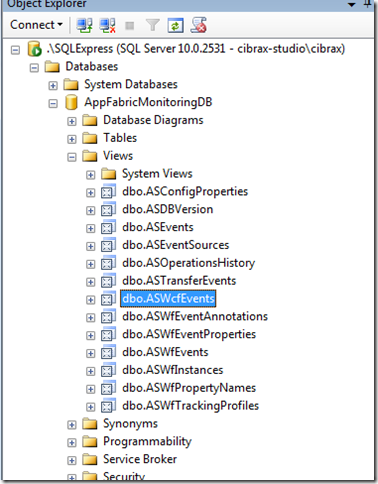
If you look at how the monitoring database for AppFabric is implemented in SQL server, there is a view “ASWcfEvents” that we can use to get all the tracking information for the events generated by WCF (this also includes any custom event that we injected in the service). As part of those events, we can get trace information or also details about any exception generated in the service.
When looking at the data returned by the view, there are two columns we will find particularly interesting, “EventSourceId” and “E2EActivityId”. The first column identifies the service that generated the entry, and the second one the specific instance of that service.
This information is really valuable for developers when troubleshooting issues, but the thing is that they need to get access to the server where the AppFabric database is hosted in order to retrieve the information they need. This is not always possible for many reasons (The service is hosted in a remote server or the devs don’t have permissions over this db for example). Something we can do to make the life easier for devs is to expose this data as a read-only OData feed that can be queried. I stick this implementation to WCF Data Services and not the new “QueryCompositon” support in the WCF Web Apis because WCF Data Services offers some useful features out of the box that we can use for this implementation. One of them is server paging, which is used to limit the number of entries that are returned on the OData feed when the client application does not specify any paging requirements (We don’t want to return the whole database with a simple query).
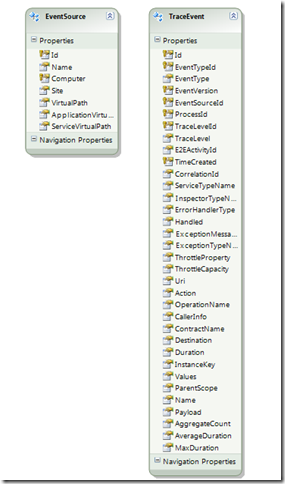
The first thing we need to do is to create an EF model for exposing the database views we want to use.
I renamed “ASWcfEvents” to “TraceEvent”, and “ASEventSources” to “EventSource” (This last one contains information about the WCF service that generated the entry such as Name, Computer, Virtual Path where the service is hosted, etc).
Once we have the EF model, we can expose it as an OData feed with a WCF Data Service as it is showed bellow,
public class TraceDataService : DataService<TraceDataSource>
{
public static void InitializeService(DataServiceConfiguration config)
{
config.SetEntitySetAccessRule("*", EntitySetRights.AllRead);
config.SetServiceOperationAccessRule("*", ServiceOperationRights.AllRead);
config.SetEntitySetPageSize("TraceEvents", 50);
config.DataServiceBehavior.AcceptCountRequests = true;
config.DataServiceBehavior.AcceptProjectionRequests = true;
config.DataServiceBehavior.MaxProtocolVersion = DataServiceProtocolVersion.V2;
config.UseVerboseErrors = true;
}
[WebGet]
public IQueryable<TraceEvent> all()
{
var virtualPath = HostingEnvironment.ApplicationVirtualPath;
var eventSources = this.CurrentDataSource.EventSources
.Where(e => e.ApplicationVirtualPath.StartsWith(virtualPath))
.Select(e => e.Id)
.ToArray();
var events = this.CurrentDataSource.TraceEvents
.Where(t => eventSources.Contains(t.EventSourceId));
return events;
}
}
As you can see, I configured the data service to make read-only all the entity sets and also set the server paging for “TraceEvents” to 50 records. I also implemented a service operation to filter the events for the services running in the same virtual directory as the data service.
So far so good, we have exposed all the AppFabric monitoring data as a OData Feed. We need to give developers with a way to correlate their service calls with the generated entries in the monitoring database. As I said before, the “E2EActivityId” is the column in the database is the one that identifies the service instance, and fortunately that identifier is easy to get from code by using the Trace Correlation Manager from the .NET Diagnostics Api.
Trace.CorrelationManager.ActivityId.ToString();
We can now inject that identifier in any service response as an Http Header so developers can use it to query the OData feed and get the information they need.
[WebGet(UriTemplate = "")]
[QueryComposition(Enabled=true)]
public IEnumerable<Order> Get(HttpResponseMessage response)
{
this.logger.WriteInformation("Orders Requested", "All Orders");
response.AddActivityHeader(this.logger.ActivityId);
return repository.All;
}
AddActivityHeader in the code above is an extension method I added to the HttpResponseMessage class. That extension method only adds a custom http header into the response.
public static class HttpResponseExtensions
{
public static void AddActivityHeader(this HttpResponseMessage response, string activityId)
{
response.Headers.AddWithoutValidation("X-Trace-ActivityId", activityId);
}
}
The logger implementation is the same one I used in my previous post to inject custom events into the AppFabric monitoring database. I added a new property ActivityId to that implementation so we can easily test our services.
After running a service with that code, a new Http Header “X-Trace-ActivityId” will be added to the response,
HTTP/1.1 200 OK
Cache-Control: private
Content-Length: 609
Content-Type: text/xml
Server: Microsoft-IIS/7.5
X-Trace-ActivityId: 4e12a0d0-f722-4082-b09d-47219f3c43bf
X-AspNet-Version: 4.0.30319
Set-Cookie: ASP.NET_SessionId=kx5ey2pgsxr3qmm4fymkuxjg; path=/; HttpOnly
X-Powered-By: ASP.NET
Date: Fri, 18 Mar 2011 16:16:03 GMT
We can use that identifier against the OData Feed to retrieve all the events for that running instance as it showed bellow,
http://localhost/WebApisMonitoring/traces/TraceEvents()?$filter=E2EActivityId eq '4e12a0d0-f722-4082-b09d-47219f3c43bf'
The complete example is available to download from here.

