DotNetStories
In this post I will continue exploring ways on how to profile database activity when using the Entity Framework as the data access layer in our applications.
If you want to read the first post of the series click here . If you want
to read the second post of the series click
here.
In this post I will use the excellent (best tool for EF profiling) which is called Entity Framework Profiler. You can download the trial - fully functional edition of this tool from here .
I will use the previous example / sample application. I will create again the simple web site, I use in my second post regarding profiling and EF.
I assume that you have access to a version of SQL Server and Northwind database.
If you do not, you can download and install the free SQL Server Express edition from here. If you need the installation scripts for the sample Northwind database, click here
1) Launch Visual Studio 2010/2008 in Administrator mode. (express editions will work fine). Create a new empty website and choose a suitable name for it. Choose C# as the development language.
2) Add a new item in your site. Add a ADO.Net Entity Data Model and name it Northwind.edmx.Place this file in the App_Code special folder.
3) From the wizard choose (create model from database) and select only the Customers,Orders and Categories tables to be included in our model.
4) Add a new item to your site, a web form. Leave the
default name. Drag and drop a Gridview control on the
form.We will get some customers back from our database by
applying some filtering.
In the Page_Load event handling routine of the Default.aspx type
            using (var ctx = new NorthwindEntities1())
            {

                var query = from c in ctx.Customers
                            where c.Orders.Any(o => o.Freight > 500)
                            select c;

                GridView1.DataSource = query;

                GridView1.DataBind();


            }
Run your application and see the results.
5) Add a new item to your site, a web form. Leave the default name-Default2.aspx. Drag and drop a Gridview control on the form.Add a button on the web form.In the Default.aspx page drop a Hyperlink control.
The Hypelink control points
to the Default2.aspx page.
<asp:HyperLink ID="HyperLink1" runat="server" NavigateUrl="~/Default2.aspx">
HyperLink</asp:HyperLink>
6) We want to insert a new category in the Categories table.We also want to get the rows in the Category table after inserting a new row.
The code for the Default2.aspx.cs page:
protected void Button1_Click(object sender, EventArgs e)
    {
        InsertIntoCategories();
        LoadCategories();
    }


    void LoadCategories()
    {


            using (var ctx = new NorthwindEntities1())
            {

                var myquery = from cat in ctx.Categories
                              select cat;

                GridView1.DataSource = myquery;

                GridView1.DataBind();

            }
        }


    void InsertIntoCategories()
    {

           using (var ctx = new NorthwindEntities1())
            {

                Category cat = new Category();

                cat.CategoryID = 10;
                cat.CategoryName = "Nice food";

                ctx.AddToCategories(cat);

                ctx.SaveChanges();

            }


    }
7) Run your website and see the records being displayed in the Default.aspx page. Click the hyperlink and you will navigate to the Default2.aspx pag and click the button in that page. Observe the new record added to the Categories table.
8) So far so good. Let's see how to use the external tool to observe the various sql statements executed in the database.
Inside the folder where you downloaded the
Entity Framework Profiler locate the
HibernatingRhinos.Profiler.Appender
DLL.Add a reference to this DLL from your web
site.
9) In the Global.asax file in the
Application_Start event type the following.
   void Application_Start(object sender, EventArgs e)
    {
        // Code that runs on application startup
        HibernatingRhinos.Profiler.Appender.EntityFramework.
EntityFrameworkProfiler.Initialize();
    }
10) Build your website.Launch the Entity Framework
Profiler and make sure it is recording.
Run your website and see the records being displayed in the Default.aspx page. Click the hyperlink and you will navigate to the Default2.aspx pag and click the button in that page. Observe the new record added to the Categories table.
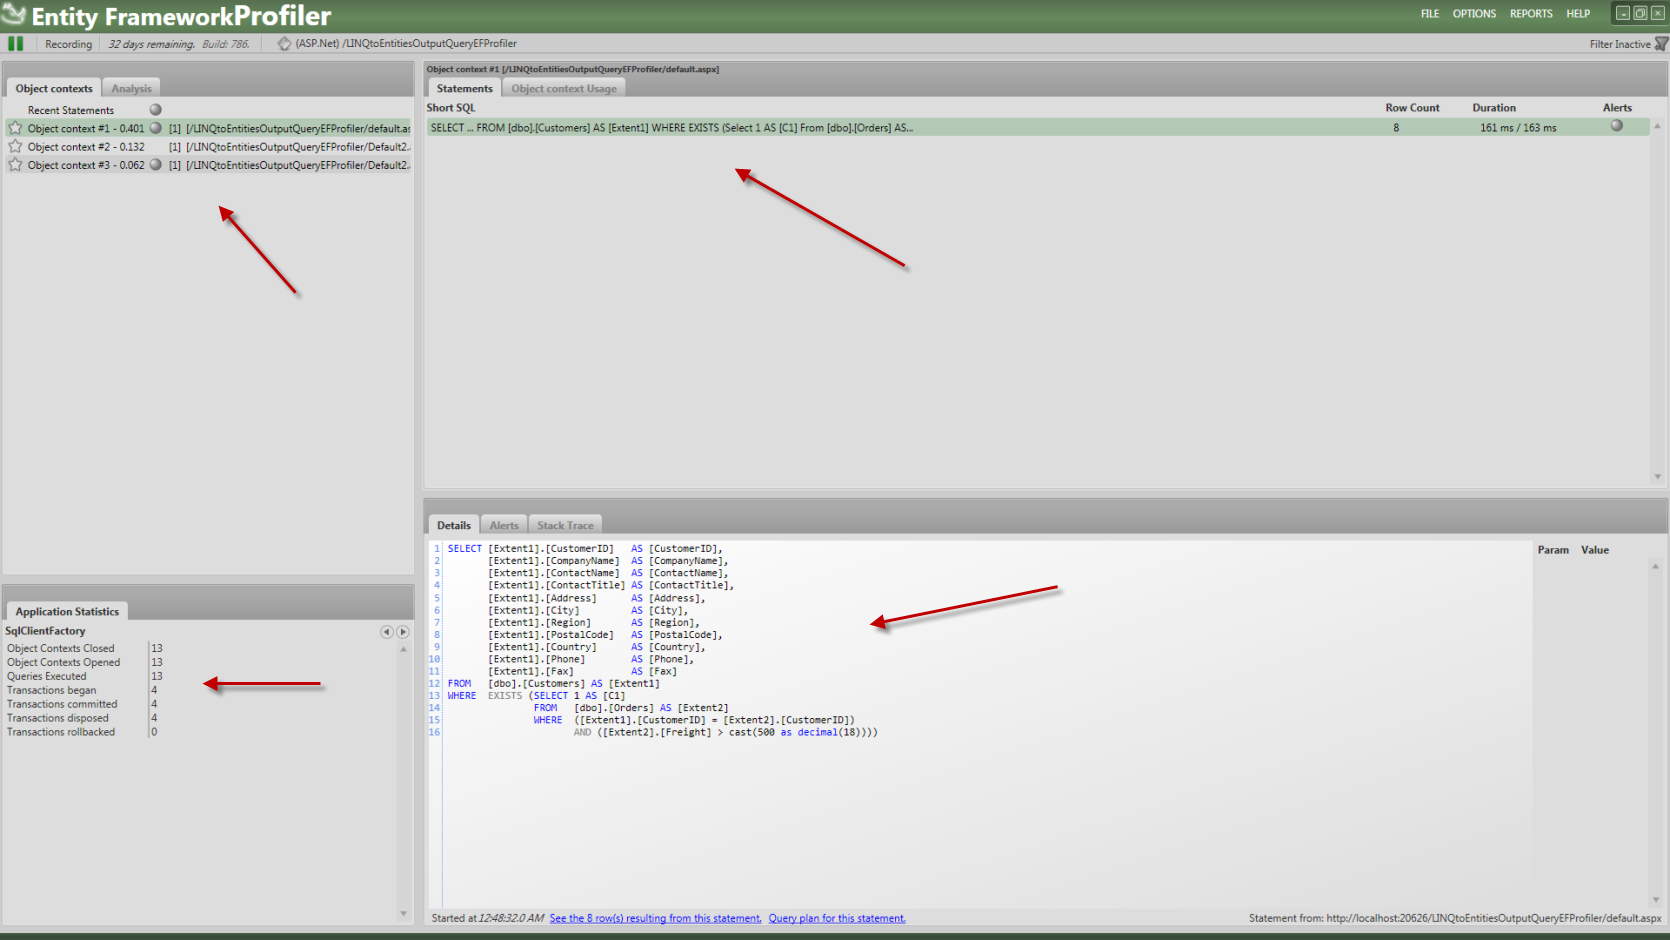
11) In the following steps I will show you a few screenshots
of the tool while recording the activity of our website.
Have a look at the screenshot. There are areas that you can see: the object context, the sort version of the SQL statement, the full version of the sql statement and the application statistics. You can also see the numbers of the rows returned and the duration time. You can also see the alerts if any...
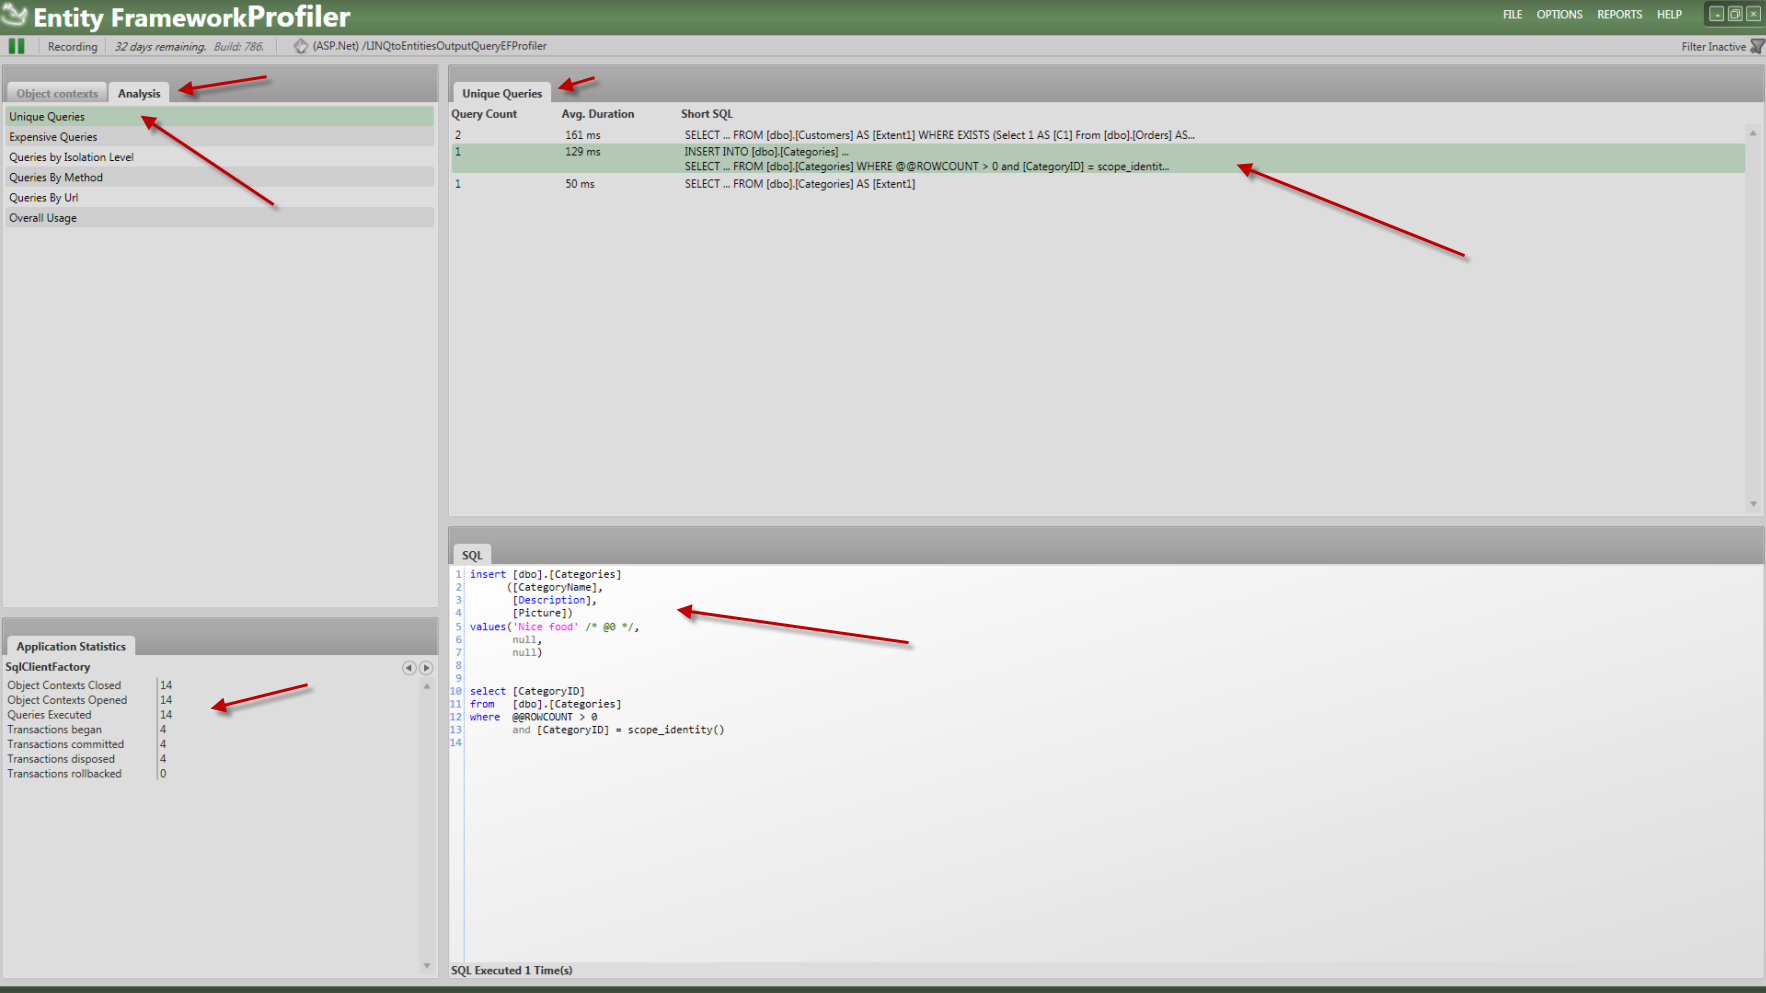
12) Now let's move on with the demonstration of the tool. When I click on the Analysis tab, I can see the unique queries, the most expensive queries,queries by isolation level, e.t.c. This is a very helpful view because we can have a look at all the queries - and the T-SQL very quickly.
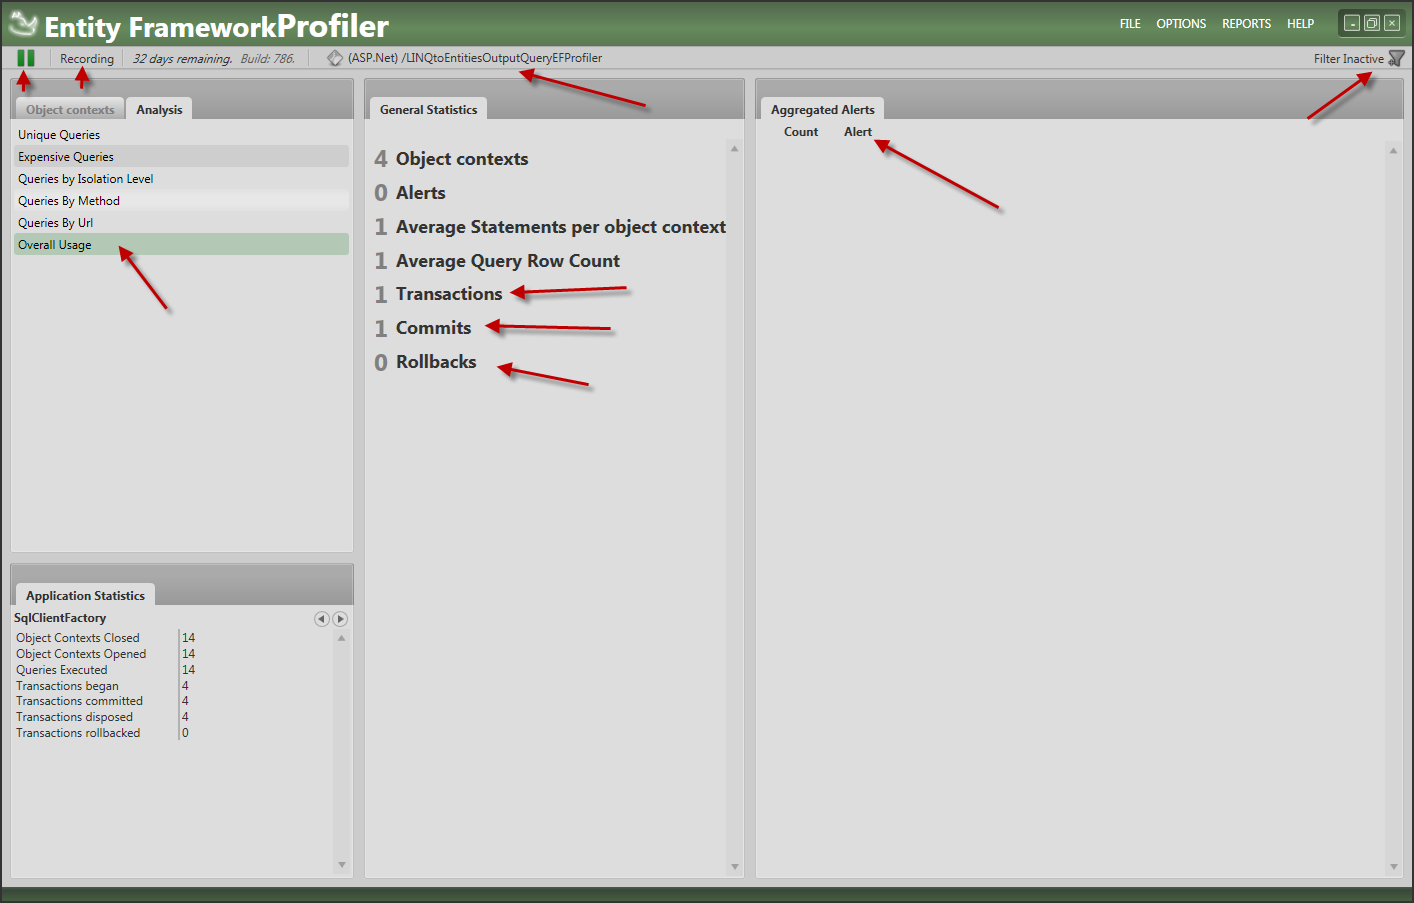
13) Let's see the Overall Usage View.
14) Let's have a look at the insert statement.You can see
the begin and commit transactions
statements.As I have said in another post of mine all the
insert,update,delete statements are treated as transactions
as far as the Entity Framework is concerned.
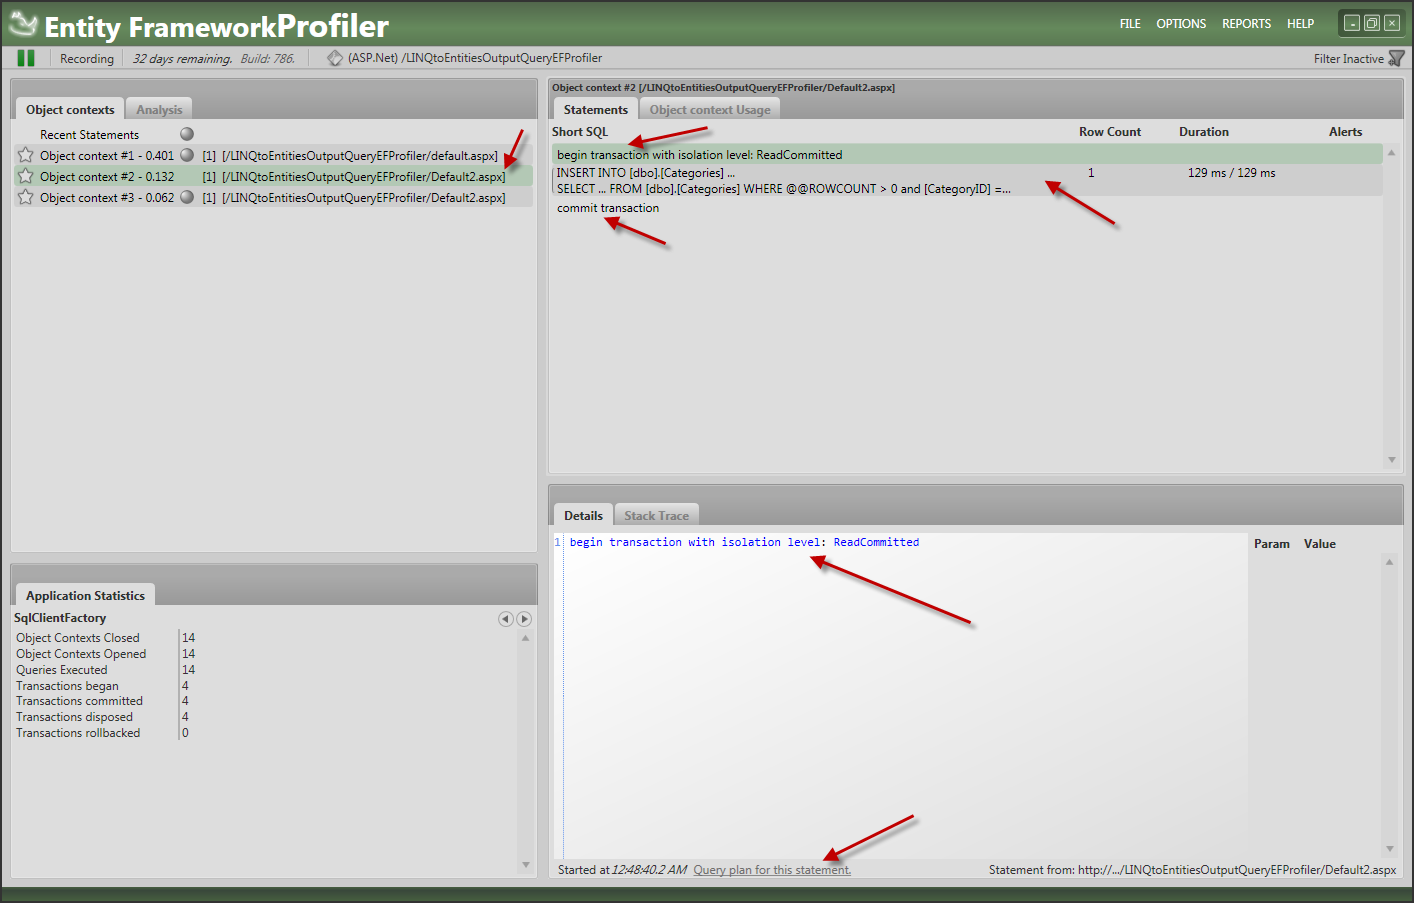
This is by far the best tool out there for database
profiling of applications using EF. We can even see
the query plan for every sql statement.
We have options for reporting and filtering. We can save the
output of the profiler to a file and load it from it.
We could not demonstrate all the functionality in this post.
The options are so many and the only way to find out is to
try it for yourself. For more screenshots have a look
here
.
Hope it helps.