Reading Azure Service Bus Metrics
I always found it interesting that most of us start counting earlier than we can read or spell our own names. Almost as if we are predispositioned to count first. Yet numbers can become very difficult later in the game.
Azure Service Bus client seems to follow the same footsteps
in its evolution. With the "old school" client
(WindowsAzure.ServiceBus)
reading message counts was a trivial exercise.
var queueDescription = await namespaceManager.GetQueueAsync("queue"));
var details = queueDescription.MessageCountDetails;
// queueDescription.MessageCount
// details.ActiveMessageCount
// details.ScheduledMessageCount
// details.DeadLetterMessageCount
// details.TransferDeadLetterMessageCount
// details.TransferMessageCount
While it looked simple and innocent, the operation of reading message counts is quite expensive and challenging on the broker side. Imagine a partitioned entity with 16 sections. To get message count, it would perform a query on all 16 brokers and aggregate the results to be served back to the client. Now imagine a "clueless" and "stubborn" client that just keeps pounding the server to get the counts every few seconds. You guessed right, it's not ideal. Message counts were not designed to be queried frequently, and such an action is an abuse.
And that's why it's going to be deprecated from the new
client
Microsoft.Azure.ServiceBus. Full stop. What do you mean it will be gone?! How will it
be possible to get message counts? Fear not. There's a way.
Eventually.
But first, let's look at a bigger picture.
Metrics aren't cheap
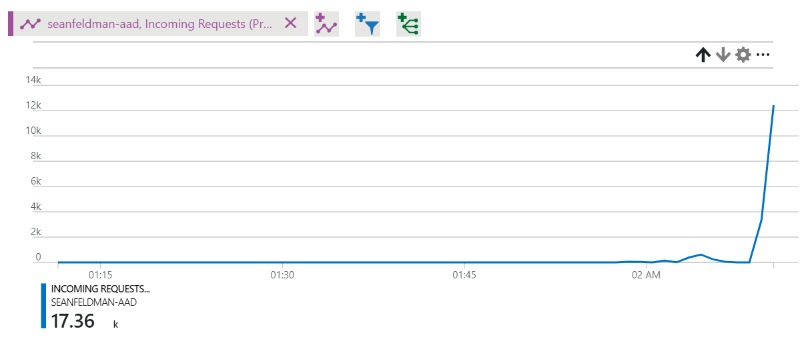
Metrics require computational time, and based on what we've already seen, it could be an extensive amount of time for the curious ones. The approach the new client is taking is: rather than allowing reading of the counts directly, to have Service Bus send data to the Azure Monitor service. In order to retrieve that information, you'd be able to either use the portal

or use the Monitor API
static async Task Main()
{
	var tenantId = "<tenant-id>";
	var clientId = "<client-id>";
	var secret = "<secret>";
	var subscriptionId = "<subscription-id>";
	var resourceId = $"subscriptions/{subscriptionId}/resourceGroups/<resource-group>/providers/Microsoft.ServiceBus/namespaces/<namespace-name>";

	var metricsClient = await Authenticate(tenantId, clientId, secret, subscriptionId);

	var metricDefinitions = await metricsClient.MetricDefinitions.ListAsync(resourceId);
	var selectedMetrics = metricDefinitions.Select(x => new { x.Name.Value, x.Unit }).Dump();

	var metrics = await metricsClient.Metrics.ListAsync(resourceId, metric: "IncomingRequests");
	Console.WriteLine(JsonConvert.SerializeObject(metrics, Newtonsoft.Json.Formatting.Indented));
}

static async Task<MonitorClient> Authenticate(string tenantId, string clientId, string secret, string subscriptionId)
{
	// Build the service credentials and Monitor client
	var serviceCreds = await ApplicationTokenProvider.LoginSilentAsync(tenantId, clientId, secret);
	var monitorClient = new MonitorClient(serviceCreds)
	{
		SubscriptionId = subscriptionId
	};

	return monitorClient;
}
In this example, code requested
IncomingRequests metric.
(Nuget packages needed for the snippet are
Microsoft.Azure.Management.Monitor and
Microsoft.Rest.ClientRuntime.Azure.Authentication)
The time-series data received will look as following (truncated):
{
  "cost": 0.0,
  "timespan": "2017-10-22T07:20:55Z/2017-10-22T08:20:55Z",
  "interval": "00:01:00",
  "value": [
    {
      "id": "/subscriptions/07d47bb1-6bc5-417e-8112-def525f89d66/resourceGroups/ServiceBusSpikes-rg/providers/Microsoft.ServiceBus/namespaces/seanfeldman-aad/providers/Microsoft.Insights/metrics/IncomingRequests",
      "type": "Microsoft.Insights/metrics",
      "name": {
        "value": "IncomingRequests",
        "localizedValue": "Incoming Requests (Preview)"
      },
      "unit": "Count",
      "timeseries": [
        {
          "metadatavalues": [],
          "data": [
            {
              "timeStamp": "2017-10-22T07:20:00Z",
              "average": null,
              "minimum": null,
              "maximum": null,
              "total": 0.0,
              "count": null
            },
            {
              "timeStamp": "2017-10-22T07:58:00Z",
              "average": null,
              "minimum": null,
              "maximum": null,
              "total": 58.0,
              "count": null
            },
            {
              "timeStamp": "2017-10-22T07:59:00Z",
              "average": null,
              "minimum": null,
              "maximum": null,
              "total": 45.0,
              "count": null
            },
            {
              "timeStamp": "2017-10-22T08:00:00Z",
              "average": null,
              "minimum": null,
              "maximum": null,
              "total": 0.0,
              "count": null
            },
            {
              "timeStamp": "2017-10-22T08:01:00Z",
              "average": null,
              "minimum": null,
              "maximum": null,
              "total": 144.0,
              "count": null
            },
            {
              "timeStamp": "2017-10-22T08:02:00Z",
              "average": null,
              "minimum": null,
              "maximum": null,
              "total": 10.0,
              "count": null
            },
            {
              "timeStamp": "2017-10-22T08:03:00Z",
              "average": null,
              "minimum": null,
              "maximum": null,
              "total": 380.0,
              "count": null
            },
            {
              "timeStamp": "2017-10-22T08:04:00Z",
              "average": null,
              "minimum": null,
              "maximum": null,
              "total": 621.0,
              "count": null
            },
            {
              "timeStamp": "2017-10-22T08:05:00Z",
              "average": null,
              "minimum": null,
              "maximum": null,
              "total": 245.0,
              "count": null
            },
            {
              "timeStamp": "2017-10-22T08:06:00Z",
              "average": null,
              "minimum": null,
              "maximum": null,
              "total": 56.0,
              "count": null
            }
          ]
        }
      ]
    }
  ]
}
Today's metrics
The metrics you can already access today are all the metrics listed under Monitor service. Remove spaces and "(Preview)" and you got a metric name.
| Description | Metric |
|---|---|
| Active Connections (Preview) | ActiveConnections |
| Connections Closed (Preview) | ConnectionsClosed |
| Connections Opened (Preview) | ConnectionsOpened |
| Incoming Messages (Preview) | IncomingMessages |
| Incoming Requests (Preview) | IncomingRequests |
| Outgoing Messages (Preview) | OutgoingMessages |
| Server Errors (Preview) | ServerErrors |
| Successful Requests (Preview) | SuccessfulRequests |
| Throttled Requests (Preview) | ThrottledRequests |
| User Errors (Preview) | UserErrors |
var metricDefinitions = await metricsClient.MetricDefinitions.ListAsync(resourceId);
Note: at this point, only namespace is an acceptable resource.
Tomorrow's metrics
What about entities and message counts? How do you get those numbers?
They are coming. Hopefully soon. Until then, review how you
use message counts in your code and plan to migrate.
Happy counting!