How to use Visual WebGui new ASP.NET integrated rapid wrapper capabilities
In this how to you will learn how to use the new Visual WebGui ASP.Net wrapper capabilities. This ability opens a new way for a Visual WebGui programmer to develop richer and even more customizable applications then before. The wrapper allows you to use third party ASP.Net components or your own ASP.Net components in Visual WebGui as fully integrated controls just like the Visual WebGui out of the box controls.
In our demo we will wrap Dundas charts and use them in a Visual WebGui application.
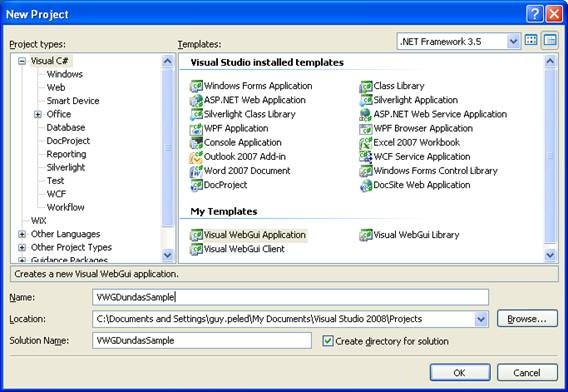
First let's create a new Visual WebGui application:
Right click the solution and click Enable Visual WebGui:
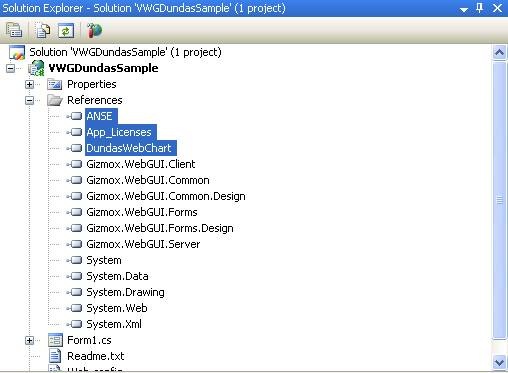
Add the necessary reference to Dundas assembles:
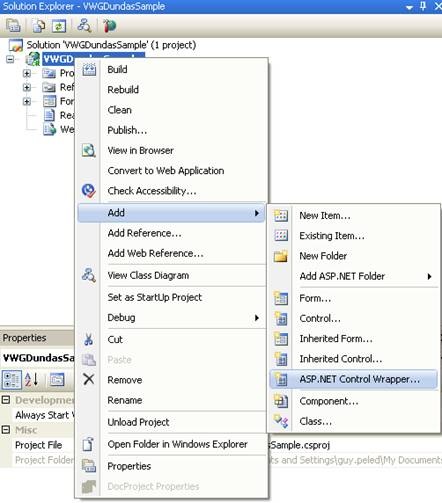
Right click the project and click "Add ASP.NET Wrapper" control:
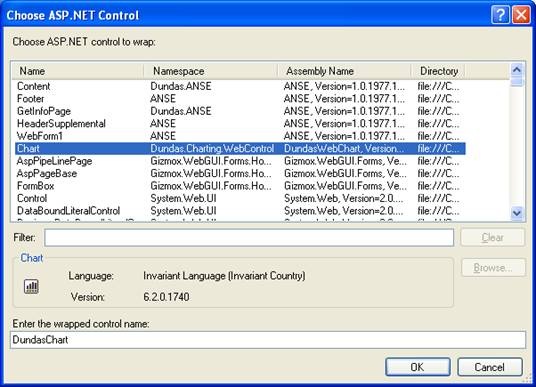
From the ASP.NET wrapper wizard select the Dundas Chart control and give it a name "DundasChart":
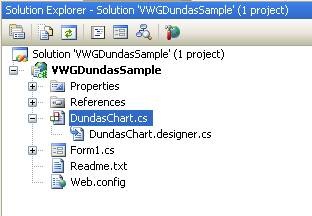
After clicking the OK button you will get a new wrapper class generated:
Because Dundas chart control renders images it needs a fixed size to relay on, otherwise you will get an error indicating that Dundas chart control does not support non pixel dimensions.
To force the wrapper to pass absolute dimensions you need to override the IsFixedSize property in the DundasChart.cs fileas following:
protected override bool IsFixedSize
{
get
{
return true;
}
}
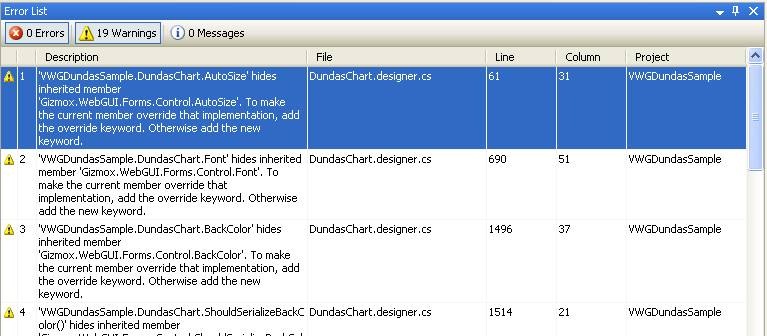
The current wrapper generator does not work out ambiguous properties and that still is left to be hand fixed. After you compile the project you will get a list of warnings regarding ambiguous properties. Fix those warnings by changing the names of the properties / methods or
simply mark out or delete the conflicting code:
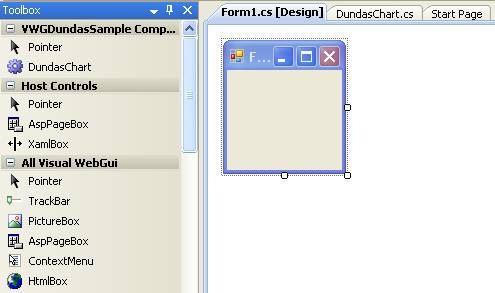
After you compile the project and you open the Form1.cs designer, you will get the new wrapper in the toolbox, like this:
Now you can drag the new wrapper control to the form which will put in a place holder like this:
The new wrapper allows you to initialize the control by using a reference to an ASCX file.
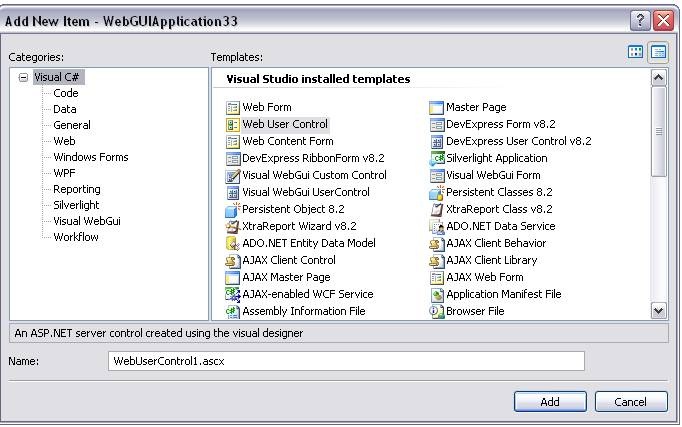
Add a new WebUserControl1.ascx to the project
And in that ASCX you can add the control code and set his initialization.
In this demo we will paste in the current code which will initialize the Dundas chart so we will be able to just insert data from code (This code is taken from a Dundas sample)
<%@ Control Language="C#"%>
<%@ Register TagPrefix="dcwc" Assembly="DundasWebChart" Namespace="Dundas.Charting.WebControl" %>
<dcwc:chart id="hosted_control_id" runat="server" Height="796px" Width="712px"
BackColor="#F3DFC1" Palette="GrayScale" backgradienttype="TopBottom"
borderlinewidth="0" borderlinecolor="181, 64, 1"
imageurl="~/TempImages/ChartPic_#SEQ(300,3)">
<legends>
<dcwc:legend LegendStyle="Row" AutoFitText="False" DockToChartArea="Default" Docking="Bottom" DockInsideChartArea="False" Name="Default" BackColor="Transparent" Font="Trebuchet MS, 8.25pt, style=Bold'></dcwc:legend>
</legends>
<chartareas>
<dcwc:chartarea Name="Default" BorderColor="64, 64, 64, 64" BackGradientEndColor="White" BackColor="OldLace" ShadowColor="Transparent" BackGradientType="TopBottom">
<area3dstyle yangle="10" perspective="10" xangle="15" rightangleaxes="False" wallwidth="0" clustered="True"></area3dstyle>
<axisy linecolor="64, 64, 64, 64" labelsautofit="False">
<labelstyle font="Trebuchet MS, 8.25pt, style=Bold'></labelstyle>
<majorgrid linecolor="64, 64, 64, 64"></majorgrid>
</axisy>
<axisx linecolor="64, 64, 64, 64" labelsautofit="False">
<labelstyle font="Trebuchet MS, 8.25pt, style=Bold'></labelstyle>
<majorgrid linecolor="64, 64, 64, 64"></majorgrid>
</axisx>
</dcwc:chartarea>
</chartareas>
</dcwc:chart>
To use an external file insert a path to your code (ASCX file) in the ControlCode property using the following format: “/[Assembly Resource Name]”
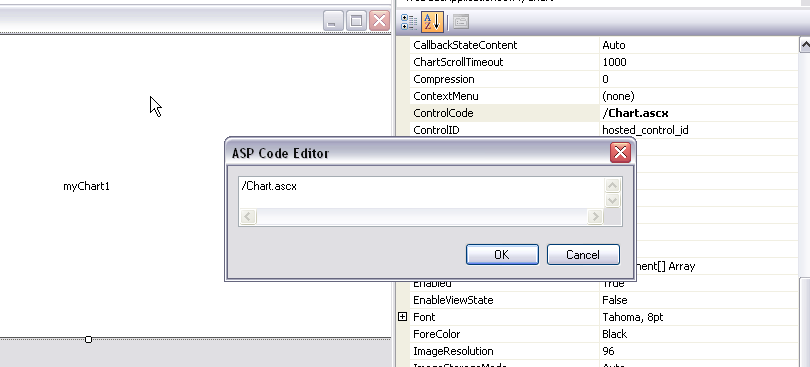
Now we can add a Visual WebGui button to the form and attach its click event to the following code (This code is taken from a Dundas sample)
string[] charts = { "Column", "Spline", "StepLine", "Spline" };
Random rnd = new Random();
private void button1_Click(object sender, EventArgs e)
{
// Add a series to the chart
Series series = myChart1.Series.Add("Series " + (myChart1.Series.Count + 1).ToString());
series.ChartArea = "Default";
series.ChartType = charts[myChart1.Series.Count - 1];
series.BorderWidth = 2;
int j = 0;
int MaxPoints = 10;
while (j++ < MaxPoints)
series.Points.Add(rnd.Next(5, 20));
myChart1.Update();
}
Open your web.config and add to it the Dundas http handler as following:
<add path="ChartAxd.axd" verb="*" type="Dundas.Charting.WebControl.ChartHttpHandler" validate="false"/>
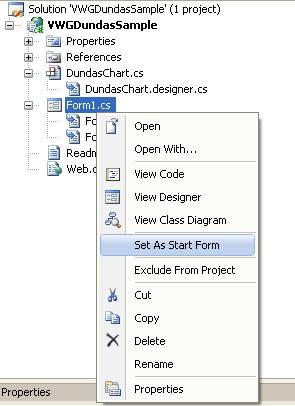
Set Form1 to be the startup form using the right click as following:
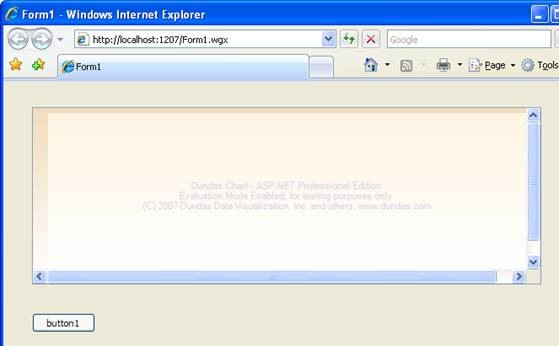
Run the application and you will get the following screen:
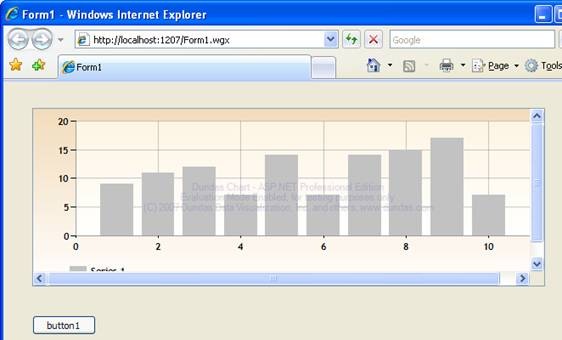
After you click the button our code will refresh the chart and display the following view:
As you can see it is very simple to create a wrapper using the new ASP.NET wrapper feature. This is the first version (6.2.1) of Visual WebGui which has this capability and we intend to simplify the procedure even more.
You can read the original how to here
-- Eyal Albert @ Eyal.Albert (at) Gizmox.com
