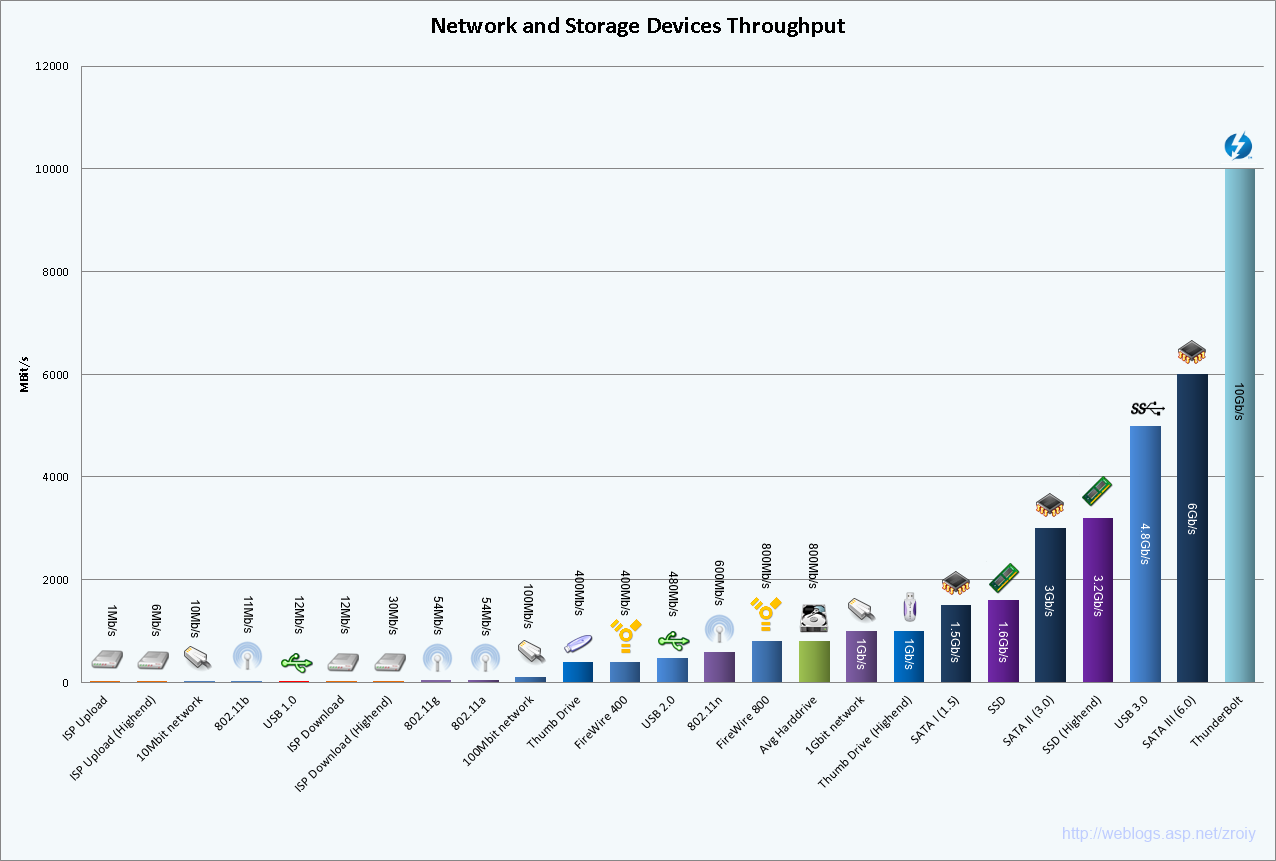
Network and Storage Devices Throughput Chart
With all of the different storage and network devices that surround our day to day life, understanding these devices data transfer speeds can be somewhat confusing.
Think about trying to identify your weakest link in the a chain that starts with an external USB hard drive (or a flash drive) that's connected to a 802.11g wifi router, can you quickly come up with an answer of where's the bottle neck in that chain , is it the router or the storage devices ? . Well, the following chart should give you an idea understanding different devices, protocols and interfaces maximum throughput speeds. Though these numbers can fluctuate (mostly for worse, but sometimes for the better) due to different kind of factors such as OS overhead (or caching and optimization) , multiple users or processes and so on , the chart can still serve to provide basic information on the theoretical throughput different devices and protocols can get to..
Enjoy.

Link to the full size chart
References:
http://en.wikipedia.org/wiki/Sata#SATA_revision_1.0_.28SATA_1.5_Gbit.2Fs.29http://en.wikipedia.org/wiki/Usbhttp://en.wikipedia.org/wiki/Usb_3http://en.wikipedia.org/wiki/802.11
http://mashable.com/2011/09/21/fastest-download-speeds-infographic/
http://en.wikipedia.org/wiki/Thunderbolt_(interface)http://www.computerworld.com/s/article/9220434/Thunderbolt_vs._SuperSpeed_USB_3.0
Icons:
http://openiconlibrary.sourceforge.net/gallery2/?./Icons/devices/drive-harddisk-3.png
