Debugging ASP.NET Web Services
All those who have ever heard about Web Services, already know what is the nature of the Web Services and why these are important especially in Distributed Systems when exchanging data from different operating systems, platforms etc.
At first, debugging a Web Service might not seem something that could make you a headache, all until you come to it, especially when passing complex types, collections and some sort of data that cannot be serialized to XML format on a simple manner.
Ahh, yes, I’ve mentioned the XML format. For those that don’t know (maybe only few out there) when exchanging data through a Web service, the data is sent/received in an standard XML format.
I’ve been working with Web Services on .NET Platform for quite long time (for me, long means about 3-4 years). There are three methods that I use to debug a Web Service, of course, depending of the concrete situation and the code I need to debug.
First case: Debugging WS same as you debug an ASP.NET Web Forms Application
ASP.NET Web Service can be debugged same as any other ASP.NET Application. The first problem that you might encounter and need to resolve it in order to proceed with debugging your Web Service is an ‘Authentication Error’.
The error is as follows:
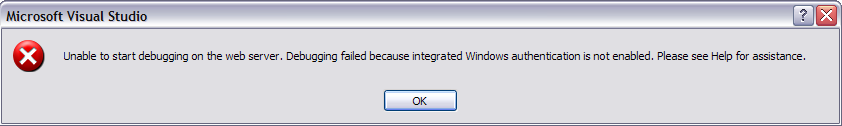 Figure 1. Error: Unable to start debugging on the web server.
This usually occurs when your website is on IIS server.
Ok. Don’t worry about it because there are only few steps you can take to make this work.
- Open your IIS server *Control Panel –> Administrative Tools –> Internet Information Services*
- Expand the node of your server. Web Sites node should opens underneath the server name.
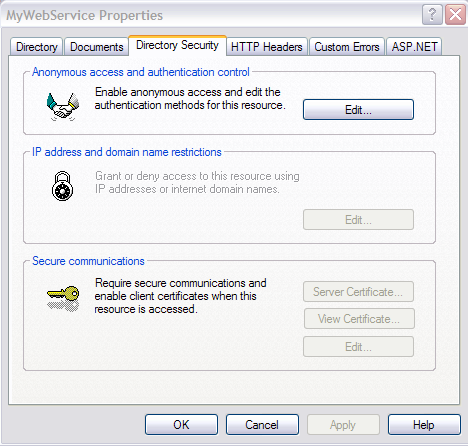
- Right click the Web Site for which you want to enable the Authentication and go to Properties.
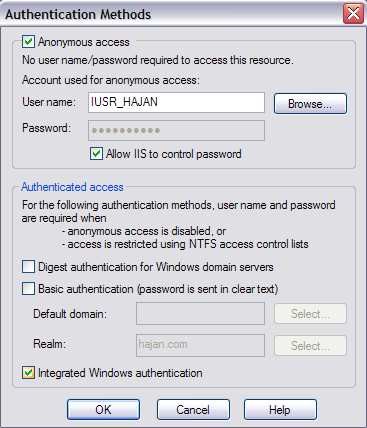
- Click the Directory Security tab. There you have the Anonymous Access and Authentication Control. Click Edit. At the bottom of the new dialog window, check the Integrated Windows authentication and click OK. Again OK. (see Figure 2)
|
|
 |
* If you are on IIS7, same steps apply up to #3 except you won’t click the Web Site with right click but just click it normally. In the center pane under IIS heading double click Authentication. Then, in the Name column right click Windows Authentication and click Enable. And, that’s it! [1]
![debuggingWS_iis7[1]](https://aspblogs.blob.core.windows.net/media/hajan/Media/debuggingWS_iis71_3A8EF92C.png "debuggingWS_iis7[1]")
Figure 3. Web Site Properties and Authentication on IIS7
Now, you will be able to hit F5 (Start Debugging) and debug your ASP.NET Web Service.
Second case: Debugging deployed WS
You might need to debug a deployed Web Service. Of course there is a way. Even, this same way you can use in a development environment because in some cases this might be a good workaround when we can’t do debugging using the normal procedure. What am I talking about? Yep, debugging a Web Service using Attach to Process method.
How to?
Well, firstly just to mention, this is not available in the Express editions of the VS.NET.
In Debug menu, you have the Attach to Process function.
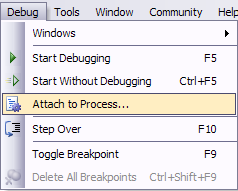
Figure 4. Attach to Process…
so, once you click Attach To Process.. following window will appear
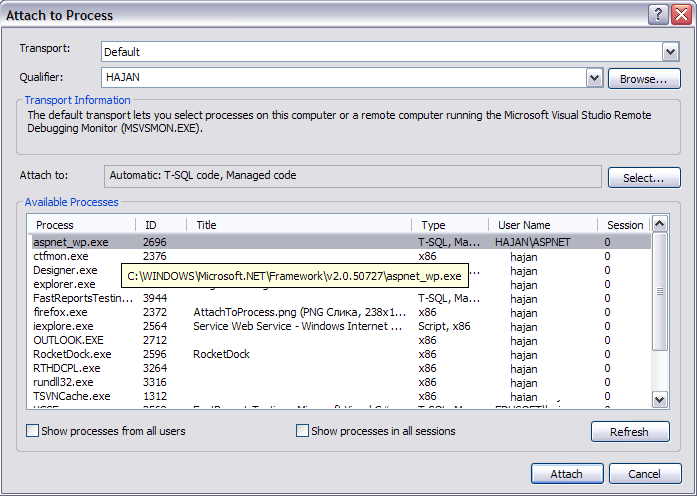
Figure 5. Attach to Process Window
You need to have Administrator privileges on the machine where ASP.NET process runs, in order to be able to debug it. Usually, the ASP.NET processes you can find in the lists are aspnet_wp.exe or w2wp.exe. In Figure 5, on my machine it is aspnet_wp.exe.
If your application is running correctly but you can't find either aspnet_wp.exe or w2wp.exe,
check Show processes in all sessions and there you should find one of
these two processes. Then attach the debugger to that process.
You can also try this by simply running your Web Service without debugging (CTRL+F5), hit a breakpoint inside the WebMethod you are going to debug it, and Attach the debugger to the Process using Attach to Process method.
Third case: Debugging Web Service methods with non-primitive types as parameters
I beat those working with Web Services has encountered this issue when working with Web Service Methods that accept non-primitive types as a parameters such as Collections, Lists or any other parameter types that can generate this issue.
For instance, I have the following two methods in my Web Service
public int Sum(int x, int y)
{
return x + y;
}
[WebMethod]
public List<string> ListItems(List<string> myList)
{
//if there is 'hajan' item in the list, add another 'hajan2' else add 'hajan'
if (myList.Contains("hajan"))
{
myList.Add("hajan2");
}
else
{
myList.Add("hajan");
}
return myList;
}
Code Snippet 1 – Web Service Methods
When you try debugging the Sum method, you won’t get any problem because the parameters are of primitive types.
C# primitive types: byte, short, int, long, float, double, boolean, char
On the other hand, when you try debugging the ListItems method, you will get the following message:
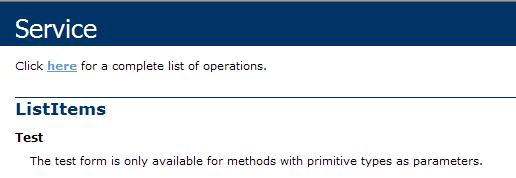 Figure 6. ListItems Web Method Test
In this case, it doesn’t matter if you hit breakpoint inside your ListItems Web Method, the debugger wont get there at all because you cannot use the Test form of your Web Service.
Ok. There might be other workarounds, but what I do in the this situation is as follows:
* You always have some test values which you are using to debug a standard asp.net method, web services web methods etc. So…
1. Create another test method, call it TempTest
public void TempTest()
{
List<string> temp = new List<string>();
//add sample data to test with
temp.Add("hajan");
//call the method
ListItems(temp);
}
Code Snippet 2 – TempTest WebMethod
2. Just add a break point in the ListItems web method and call the TempTest() method from the list
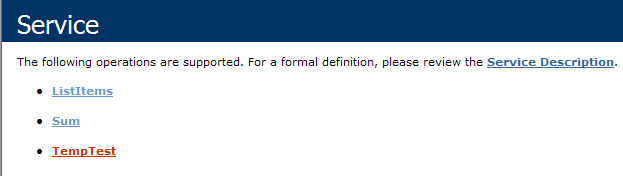
Figure 7. List of Web Service Methods
It will point you automatically to the break point inside ListItems() Web Method and will let you debug it.
In this case, we have seen workaround on debugging WS Web Methods that accept non-primitive input parameters.
Additional case: Timeout error while debugging
In some cases, you may encounter timeout problem while debugging your Web Service. Once the call time out, you cannot continue debugging your web service. The error comes from System.Web.services.dll and is of type System.Net.WebException.
To avoid this timeout error happens again, you can set –1 TimeOut limit of your Web service object you’ve created on the Web Service consumer application (client-app), which means infinite timeout.
Example:
sr.Timeout = -1;
Code Snippet 3 – Set timeout to Web Service Object
Conclusion (shortly)
I know that all these previously explained issues and methods have been already mentioned somewhere else, especially in the MSDN library of articles, but I thought it would be nice to write a blog post with my own explanation and examples so that it might be helpful to someone out there. Debugging ASP.NET Web Service isn’t very different with debugging a normal ASP.NET Web Application. If you are already enough experienced in debugging ASP.NET Web Applications, you probably know all the previous explained methods and tips, and of course, I would be glad to see your comments and suggestions especially if you have anything to add or remove from the methods and tips I have shown in this blog post.
Thank you for your time while reading my blog post.
Best Regards,
Hajan
//more to read…
Reference links
- Error: Debugging failed because Integrated Windows Authentication Is Not Enabled
- Infinite timeout for Web Service
- Debugging ASP.NET Web Services