IE 8 Can Profile JavaScript
Being on the software "bleeding edge" is similar to being the "point man" in combat. I generally avoid being the first to adopt new technology until some other poor bastard has led the way…and occasionally paid a price: The price being missed deadlines, ulcers and ruined reputations. No thanks.
However, with Internet Explorer 8, for some inexplicable reason, I jumped right in. And I was pleasantly surprised. One of the nicest features is the new Developer Tools toolbar that comes with IE 8. Previously the Developer Toolbar was an add-on.
On the Developer Tools window there is a new Profiler tab. Since there have been recent performance issues on the Asp.Net forums where I'm a moderator, I thought I'd give it a spin.
- I clicked Start Profiling.
- I navigated to the Asp.Net forums website.
- I waited for the page to finish loading. Having the Profiler running slows things down quite a bit…which is understandable.
- After the page had finished loading, I clicked Stop Profiling.
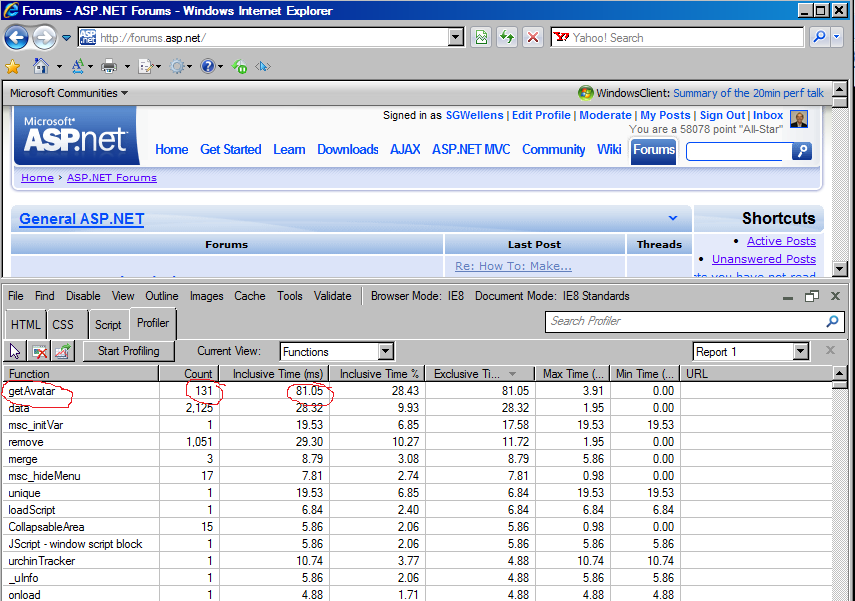
It was that easy. The results are below. It appears the getAvatar function is taking a lot of time. If each call to getAvatar results in a database call, and each call results in an image being resized, that could explain why there are performance issues.
I hope you find this useful.
Steve Wellens.