Razor Debugger for ASP.NET WebPages
I have neglected blogging recently because I’ve been super busy working on Razor tooling, NuGet and Beta 3 Release of the Web Stack. Now that I have some free time, I can blog about a really cool project I’ve been working on.
The Razor Debugger is a simple web based debugger for ASP.NET WebPages (it might work in MVC but hasn’t really be tested). It started off as an experiment to see if it was possible to have a simple debugging experience for developers using WebMatrix.
It’s a NuGet Package
Of course the Razor Debugger is distributed as a NuGet package and is available today on the WebMatrix feed. You can learn more about ASP.NET WebPages package management here.
Debugging Tutorial
Let’s step through a simple example on how to use the debugger with your site.
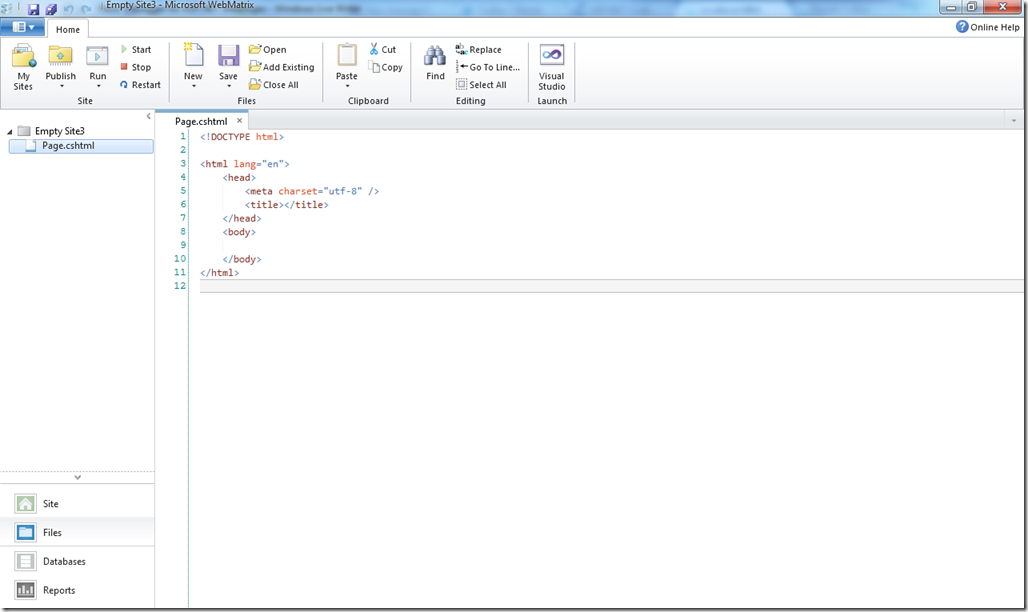
Start by opening WebMatrix and choose Site From Template. Create a new Empty Site and create a new cshtml page.
Next, we’re going to install the RazorDebugger through the admin UI. Launch the website and navigate to the _Admin url in your browser:
Type your secret password and continue to the Package Manager. List all packages from the online feed and install the RazorDebugger package:
After installing the debugger, navigate to the debugger page by going to ~/debugger.
The debugger is a section of the website that shows all of the pages on the left, and some UI on the right that we’ll describe in further details below.
To start debugging your site, put some code in the page and click on the page in the debug view.
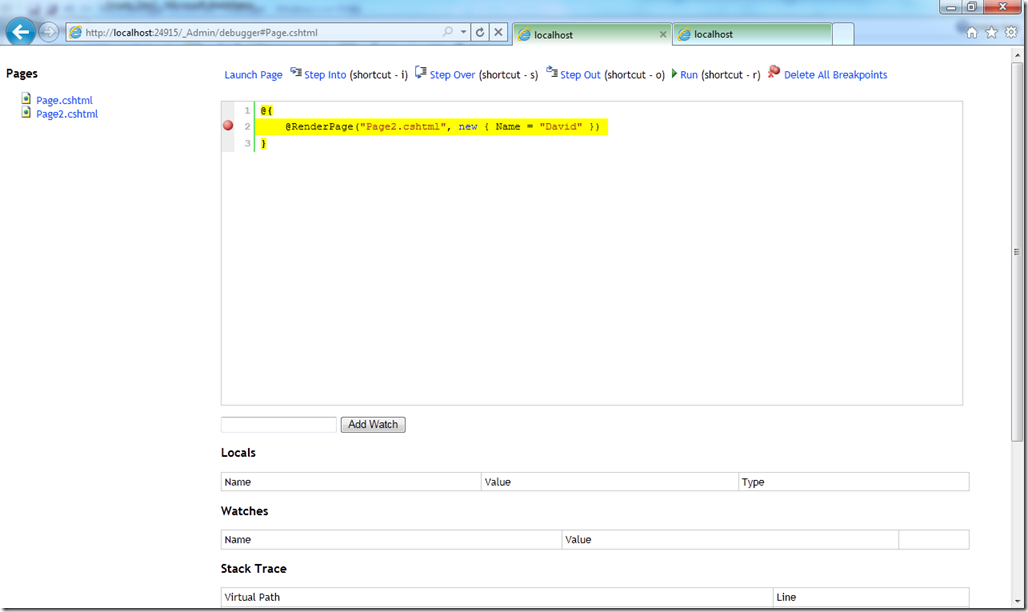
Now that we have some code in our page we can set a break point by clicking on the gray pane beside the line numbers in source view. When a break point is set, a red circle will be placed on the line where the break point was set.
Start debugging! Click on Launch Page at the top of the page to run the page. Switch back to the debugger and see the break point being hit.
Now that we’re debugging, we can use the Step Into, Step Over, Step Out and Run buttons or the associated shortcut keys. Also, as you step, the locals, watches and stack trace UI at the bottom will change to show locals and watches respectively.
You can also change the values of locals by clicking on the value of the local and typing a new one.
Stepping into other pages
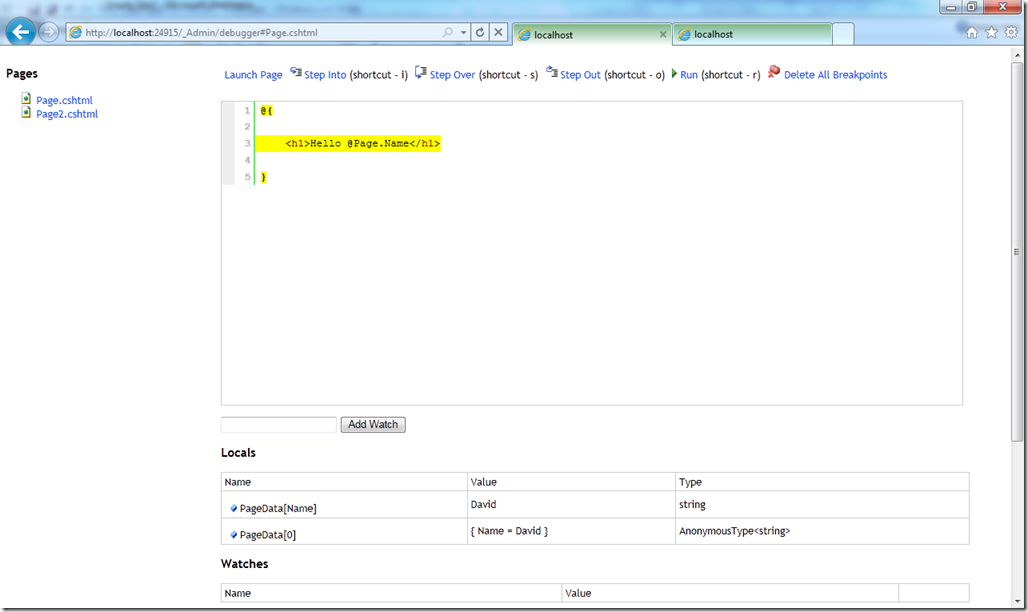
It’s possible to step into other pages if a call to RenderPage is made within the page you are debugging. I’ve updated the sample to contain 2 pages, Page.cshtml passes an anonymous type with the Name “David” to Page2.cshtml.
Now we can hit Step Into or i and step into Page2.cshtml.
Exceptions
The debugger also supports unhandled exceptions. The page below shows an example of a NullReferenceException. When an exception occurs the line is highlighted with a dotted border (it’s kind of hard to see) and the exception object shows up in the locals window.
Start Debugging
This debugger is a prototype and isn’t meant to replace the debugger in visual studio by any means. It is however a pretty cool experiment and you can try it out today in your ASP.NET WebPages!


