Developer Dashboard in SharePoint 2010
Introducing the Developer Dashboard
As a SharePoint developer (or IT Professional), how many times have you had the pleasure of figuring out why a particular page on your site is taking too long to render? I'm sure one of the techniques you have employed in troubleshooting is the process of elimination - removing individual web parts from the page hoping to identify which web part is misbehaving.
One of the new features of SharePoint 2010 is the Developer Dashboard. This dashboard provides tracing and performance information that can be useful when you are trying to troubleshoot pages that are loading too slow.
The Developer Dashboard is turned off by default and I'll go over 3 different ways to display it. Here is a screenshot of what the Developer Dashboard looks like when displayed at the bottom of the page:
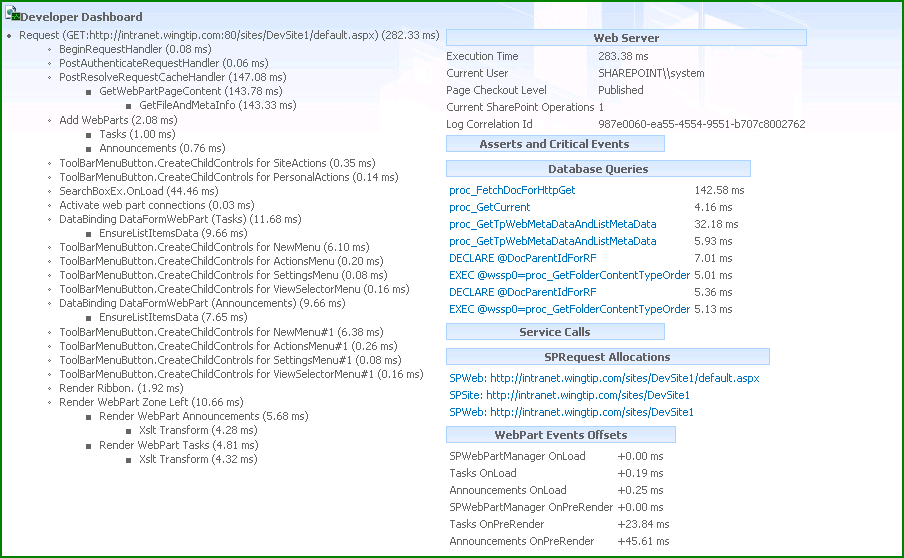
You can see on the left side the different events that fired during the page processing pipeline and how long these events took. This is where you will see individual web parts being processed and how long it took to complete (obviously the kind of processing depends on what the web part does).
On the right side you would see the different database calls issued through the SharePoint Object Model to process the page. You will notice that each of these database queries are actually a hyperlink and clicking on it displays a pop-up window that shows the actual SQL Query Text, the Call Stack that triggered the database call, and the IO statistics of that query.
Enabling the Developer Dashboard
Option 1: Managed Code
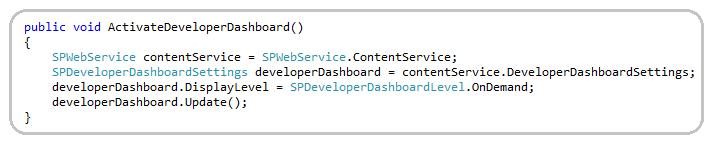
The Developer Dashboard is a farm-wide setting and the code above won't work if it is used within a web part hosted on any non-Central Admin site. I personally won't put this code inside a custom web part anyway. You would probably put this code on a custom SharePoint feature where it gets called when the FeatureActivated event fires.
The SPDeveloperDashboardLevel enum has three possible values: On, Off, and OnDemand. Setting it to On will always display the Developer Dashboard at the bottom of the page. Setting it Off will hide the Developer Dashboard. Setting it to OnDemand will add an icon at the top right corner of the page (see screenshot below) where a Site Collection Admin can toggle the display of the Developer Dashboard for a particular site collection.

In my opinion, OnDemand is the best setting when troubleshooting a page or during development since a Site Collection Admin can turn it on or off and for a particular site only. The first cool thing about this is that the Site Collection Admin that turned it on will be the only one to see the Developer Dashboard output. Everyday users won't see the Developer Dashboard output even if it was turned on by a Site Collection Admin. If you need more flexibility on who gets to see the Developer Dashboard output, you can set the SPDeveloperDashboardSettings.RequiredPermissions to control which group of users will have the permission to see the output.
Option 2: Using stsadm
Using stsadm, you can run the following command to configure the Developer Dashboard:
STSADM –o setproperty –pn developer-dashboard –pv OnDemand
To successfully execute this command, be sure you that are running as a Farm Admin.
Option 3: Using PowerShell Scripting
For all scripts in SharePoint 2010, I prefer writing them as PowerShell scripts. Though the stsadm command is less verbose, the PowerShell equivalent is pretty straightforward and uses the SharePoint Object Model:

You can of course parameterized the value that gets assigned to the DisplayLevel property so you can turn it On, Off or OnDemand depending on the parameter.
Events and the Developer Dashboard
Now, don't assume that all the code inside your web part or page will show up in the Developer Dashboard complete with all the great troubleshooting information. Only a finite set of events are monitored by default (for a web part it will events in the base web part class). Let's say you have a click event that could take some time, for example a web service call. And you want to include troubleshooting information for this event in the Developer Dashboard. Enter SPMonitoredScope which is also a new feature in SharePoint 2010. In SharePoint 2010, everything is executed within a "Monitored Scope". And each scope has a set of "Monitors" that measures and counts calls and timings which appears in the Developer Dashboard. Below is an example on how to get your custom code to get included in the Developer Dashboard by wrapping it inside a new monitored scope:

The code above would include your new scope "My long web service call" into the Developer Dashboard and would log the time it took to complete processing.
In my opinion, wrapping your custom code in a SPMonitoredScope is a SharePoint development best practice since it provides you visibility and a better understanding on the performance of your components.
Summary
The Developer Dashboard is a nifty tool that you can use to gain a better understanding on how your various SharePoint components are performing. Coupled with the ability to wrap your custom code inside a SPMonitoredScope, you will be able to monitor how long does it take for your code to complete processing via the Developer Dashboard. Happy Dashboarding!