Troubleshooting an Intermittent .NET High CPU problem
We’d been getting sporadic reports of high CPU usage in Witty (a WPF Twitter client). I’d tried running the application in debug mode for a while and could never get it to occur, but finally I saw it happening while I was running a release build (keep in mind that 53% is indicating that one of my two CPU cores was saturated):

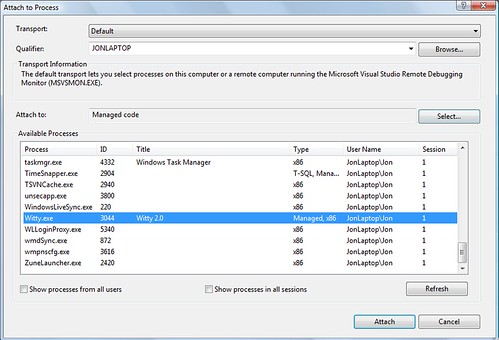
Great, let’s attach a debugger to see what’s going on:
Troubleshooting high CPU use often leads to chasing heisenbugs, since the CPU usage of course drops when you break into the code. But, I could at least step through the current code a bit to get an idea of the current state. Doing that showed a lot of time at System.Threading.WaitHandle.WaitOne, which made me suspect at threading issue.
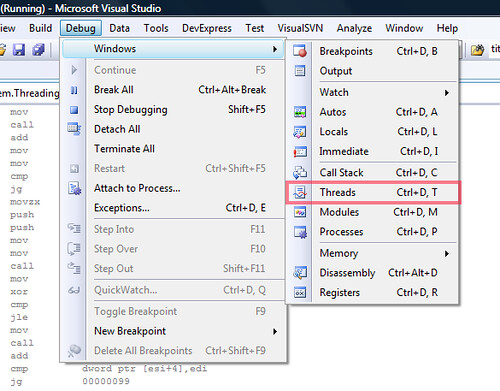
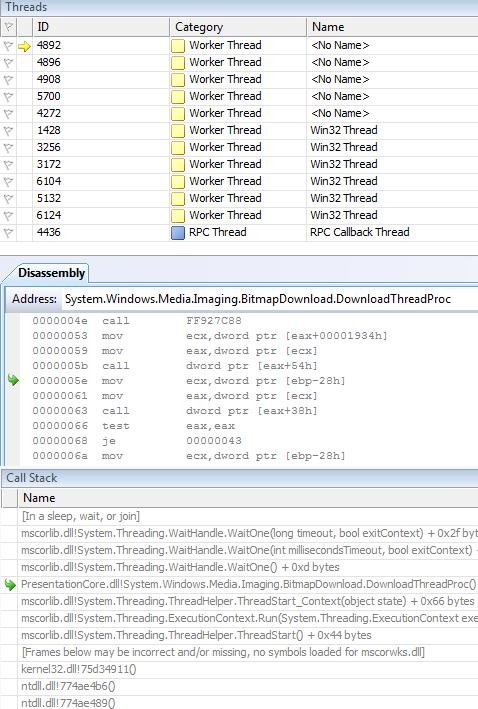
On the other hand, breaking into a multithreaded app could have caused that, too. We need more information – let’s take a look at the current threads:
Note to self: should have named the threads so I’d have a better idea of what they’re all doing. I’ll talk more about that in a little bit.
Now, there are probably two ways to go from here:
- Smart, systematic debugging
- Brute force hacking
In this case case, since we don’t have that many threads to deal with, I think starting with some brute force interrogation is a good way to get started. If we don’t find anything, we’ll cool off and do the whole Sherlock Holmes contemplation thing, complete with pipe and violin.
First Guess: The Red Herring
This is not the real problem, it’s a wrong guess. I’m including this for two reasons:
- It’s the truth. It’s what I really did. I’m not going to edit out my stupidity… this time.
- It shows a little interesting information on loading symbols from the Microsoft symbol servers to step into and debug .NET framework code
That said, if you want to skip over this bit, I won’t be offended in the least.
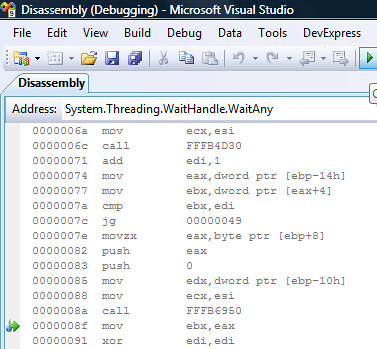
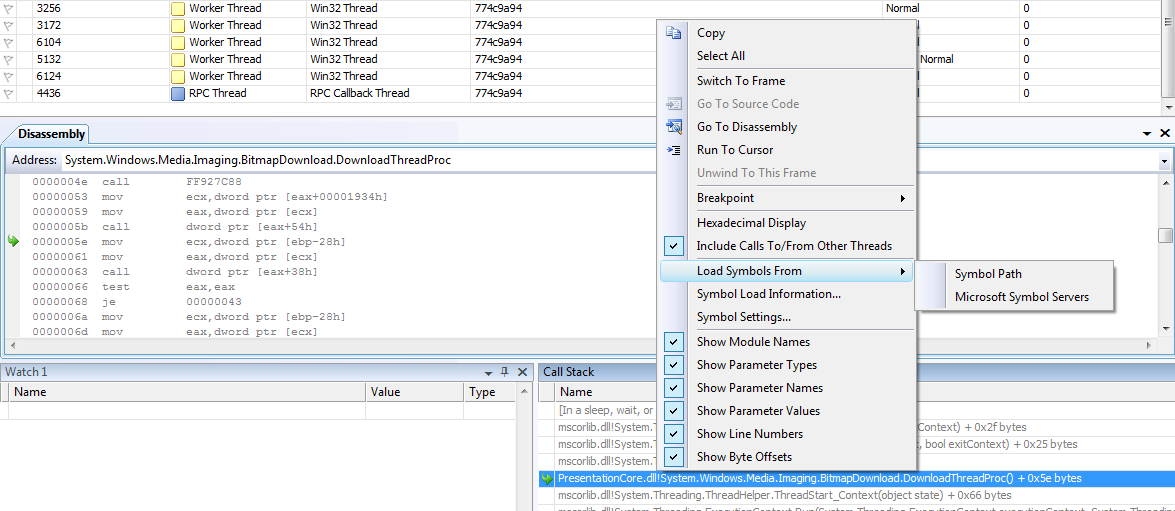
So at this point, I started just looking through the thread list. When we activate a thread, even in disassembly, we can get a pretty good idea of what it’s doing. There’s a current call stack, and the disassembly view shows us the current executing method:
Well, our current hunch is that the System.Threading.WaitHandle.WaitOne call has to do with the problem, and it’s showing up as the current executing method, so it’s worth looking at for a bit. But that disassembly is over my head. We need to get the actual source… fortunately, that’s not tough. We can load the source from the Microsoft Symbol Servers:
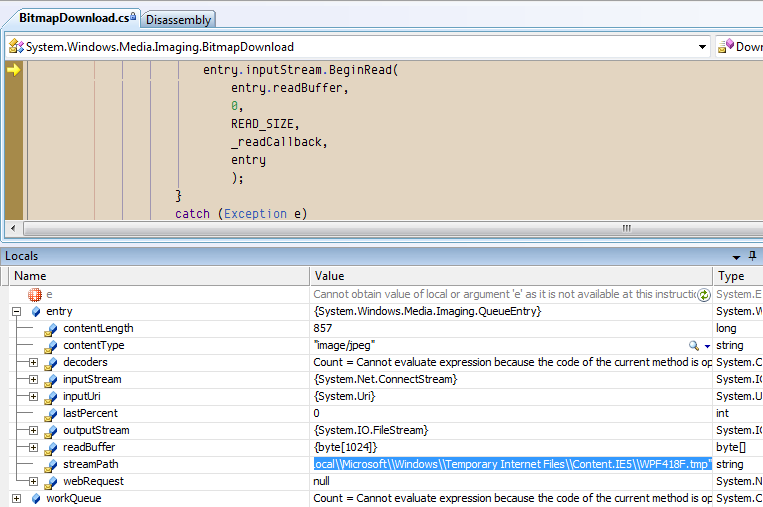
And a few seconds later, we’re interactively debugging framework code. Paging Dr. Awesome…
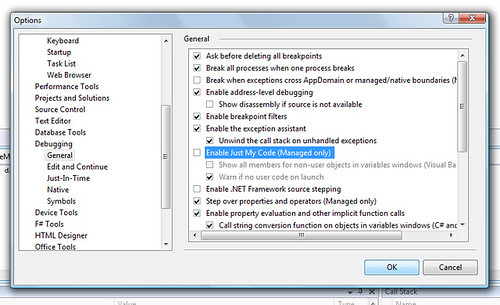
Note: If you’re not able to see the framework code in the call stack, you’ll need to turn off the “Just My Code” debugger option:
I’ll spare you the embarrassment of watching me wander around the WPF code which pulls down databound images from internet addresses. It’s interesting code, but after poking around for a bit I convinced myself that this wasn’t the source of the high CPU issues.
Wising Up: Freezing Threads To Find The Culprit
At this point, I realized that I needed to get a little smarter. Instead of just browsing through all these threads just hoping to find the problem, I needed a smarter way to determine which one was actually the problem. Well, how about this?
- Break into the debugger
- Freeze one of the threads
- Resume the app
- See if the CPU usage has dropped – if so, we’ve found the bad thread, so we can debug it
- If not, repeat
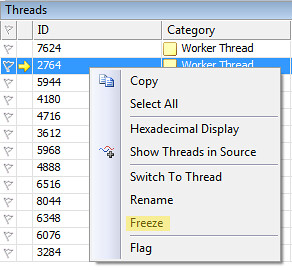
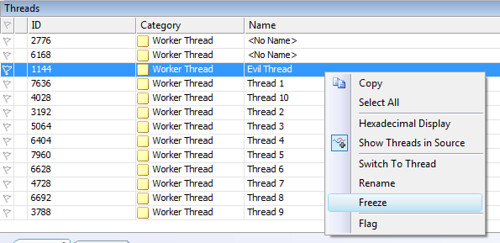
Simple enough. You can right click any of the threads in the list and freeze it:
Now, this is still kind of voodoo troubleshooting at this point, since there’s a possibility that the problem’s caused by the interaction of two different threads, or something else that’s going to be masked by a one-at-a-time approach. I’m playing another hunch here – I know enough about this application to assume that most of the threads are independent.
Intermission: Play Along At Home with this Simple Runaway Thread Demo
This may be a little tough to follow since there are a lot of moving parts. Let’s step back and look at a very simple application with one runaway thread. Create a new console application and add the following code:
using System.Threading;

namespace RunawayThreadSample
{
    class Program
    {
        static void Main(string[] args)
        {
            for (int niceThreads = 1; niceThreads <= 10; niceThreads++)
                new Thread(() =>
                   {
                       while (true)
                           Thread.Sleep(500);
                   }) { Name = "Thread " + niceThreads }.Start();

            new Thread(() =>
               {
                   while (true)
                   { }
               }) { Name = "Evil Thread" }.Start();
        }
    }
}
A few things to notice here:
- We’re naming our threads this time. With .NET 3.5’s object initializer syntax, we can set the name when it’s created.
- We’re using lambda syntax to define the anonymous thread delegates – that’s the “() => {…}” stuff. Karl Seguin covered that pretty well in his Back To Basics series.
Start up Task Manager (or run ProcMon), then run the application. You should see your CPU use pegged at around 100%, as the “Evil Thread” spins in a tight loop. Now break into the debugger – you should see your CPU usage drop as all the threads are suspended. Freeze the Evil Thread (right-click, freeze):
Then resume the application (by hitting F5) and you should see your CPU usage stays low.
Returning To Our Regularly Scheduled Program…
Sure enough, freezing and thawing threads in turn points me to a single thread which is causing the high CPU usage – one that’s spending a lot of time in Witty.SingleInstanceManager.WaitForSignal(). Interesting… a little searching lets me know that this class came from a CodeProject article about how to enforce a single instance for an application. So that explains why this bug was hard to reproduce – it only happened when the application was already running and you tried to start a second instance. That’s not something you’d normally do on purpose, so the bug just appeared to happen randomly.
But why didn’t we ever see it in debug mode? Let’s look at the code that sets up the single instance manager:
/// <summary>
/// Enforce single instance for release mode
/// </summary>
private void SetupSingleInstance()
{
#if !DEBUG
    Application.Current.Exit += new ExitEventHandler(Current_Exit);
    _instanceManager = new SingleInstanceManager(this, ShowApplication);
#endif
}
And there we go – the single instance manager only runs in release mode. Heisenbug magnet! Removing the #if pragma command lets us debug the single instance manager, so now it’s time to take a look at that WaitForSignal() method:
// thread method will wait on the event, which will signal
// if another instance tries to start
private void WaitForSignal()
{
    while (true)
    {
        uint result = WaitForSingleObject(m_EventHandle, INFINITE);

        if (result == 0)
        {
            m_Instance.Dispatcher.Invoke(System.Windows.Threading.DispatcherPriority.Normal, m_callback);
        }
        else
        {
            return;
        }
    }
}
There’s the bug - if you know the answer, just keep quiet so you don’t spoil it for the rest of the class.
Let’s take a look at how that WaitForSingleObject thing is working. First, when the application starts, we’re grabbing an Event Handle with OpenEvent, then spinning off a thread that calls WaitForSignal (code above):
public SingleInstanceManager(Window instance, ShowApplicationCallback callback)
{
    m_Instance = instance;
    m_callback = callback;

    //try to our event
    m_EventHandle = OpenEvent(EVENT_MODIFY_STATE | SYNCHRONIZE, false, EVENT_NAME);
    if (m_EventHandle == IntPtr.Zero) //if it doesn't exist
    {
        //create our event
        m_EventHandle = CreateEvent(IntPtr.Zero, true, false, EVENT_NAME);
        if (m_EventHandle != IntPtr.Zero) //if successfull
        {
            Thread thread = new Thread(new ThreadStart(WaitForSignal));
            thread.Start();
        }
    }
    else
    {
        SetEvent(m_EventHandle);
        MessageBox.Show("There is already an instance of Witty");
        Environment.Exit(0);
    }
}
So, here’s how it’s working – the OpenEvent is getting a handle, and the WaitForSignal method calls WaitForSingleObject, which will return 0 when signaled (that is, when another instance of the same handle is detected). Note – it looks like we’re running a tight loop with while(true), but when WaitForSingleObject is called with an INFINITE timeout, it won’t return until the object is signaled, meaning that the loop will never complete a single run unless a second instance is run.
But what happens when a second instance is started? Well, WaitForSingleObject returns 0, and we invoke the callback method, which just shows the application. No problem…
Except that now we’re in a tight loop. We’ll complete the loop, call WaitForSingleInstance, which will now immediately return 0 because it’s been signaled. There’s our high CPU bug. The solution is to call ResetEvent once we’ve shown the application, so that WaitForSingleObject won’t fire off again the next time through:
// thread method will wait on the event, which will signal
// if another instance tries to start
private void WaitForSignal()
{
    while (true)
    {
        uint result = WaitForSingleObject(m_EventHandle, INFINITE);

        if (result == 0)
        {
            m_Instance.Dispatcher.Invoke(System.Windows.Threading.DispatcherPriority.Normal, m_callback);
            ResetEvent(m_EventHandle);
        }
        else
        {
            return;
        }
    }
}
Now that we’re calling ResetEvent, we stay out of that tight invocation loop and we’ve licked this CPU bug. To be honest, unnecessary loops are a common source of bugs, and this one still kind of freaks me out even if the timeout on WaitForSingleObject is infinite. Given given time I’d like to look at some other single-instance solutions, but there’s no real performance driver for that.
Just Hacking Here
This has pretty much been “Git ‘R Done” debugging. It’s hacking. Hopefully it’s helpful to you, but I know that there are folks out there with some real skill at diagnosing application performance issues, and there are better debugging tools available, too. How would you go about diagnosing something like this?