Quick Attach and Detach Debugger
Here's a trick I often use in Visual Studio to speed up the trial-and-error process.
A disadvantage of using an ASP.NET Web Application Project instead of an ASP.NET Web Site is that you cannot edit code behind files (or basically any code file in your web project) while you are debugging. So to edit just minor things there, you need to stop the debugger (which closes the browser typically), edit, compile and start the debugger again, which could take some time.
I have written (recorded and adjusted) a small VS macro that attaches the debugger for me. It will actually look if the VS built-in webserver is active. If not it will attach to IIS.
Sub AttachDebugger()
Try
Dim dbg2 As EnvDTE80.Debugger2 = DTE.Debugger
Dim trans As EnvDTE80.Transport = dbg2.Transports.Item("Default")
Dim dbgeng(1) As EnvDTE80.Engine
dbgeng(0) = trans.Engines.Item("Managed")
Dim proc2 As EnvDTE80.Process2
Try
proc2 = dbg2.GetProcesses(trans, "").Item("WebDev.WebServer.EXE")
Catch ex As Exception
proc2 = dbg2.GetProcesses(trans, "").Item("w3wp.exe")
End Try
proc2.Attach2(dbgeng)
Catch ex As System.Exception
MsgBox(ex.Message)
End Try
End Sub
Copy this in one of your Macro modules and it should compile. The script could be a bit different on Windows XP, because the ASP.NET process is called "aspnet_wp" there...
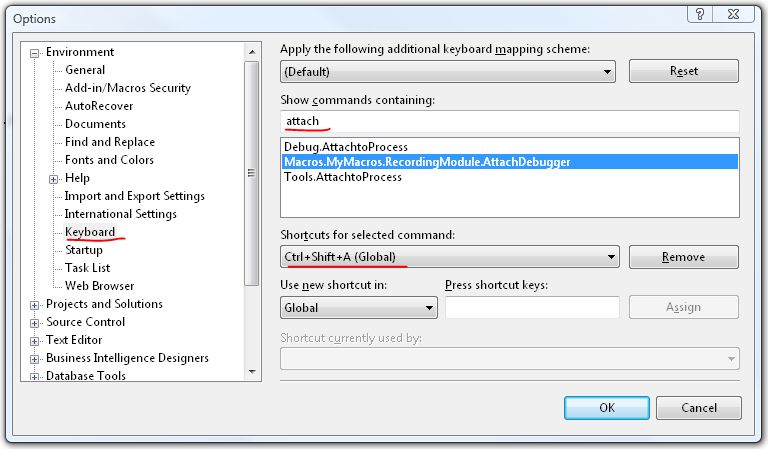
And then assign shortcuts to your macro. For detaching you don't need a macro, it's a built-in command. My shortcut's are Ctrl+Shift+A for attaching and Ctrl+Shift+D for detaching.
Now you can detach your debugger (leaving the browser open), edit the code, build it (only build what you changed), attach and refresh the browser...