Testing Mobile Websites with Adobe Shadow

It’s no surprise that mobile development is all the rage these days. With all of the new mobile devices being released nearly every day the ability for developers to deliver mobile solutions is more important than ever. Nearly every developer or company I’ve talked to recently about mobile development in training classes, at conferences, and on consulting projects says that they need to find a solution to get existing websites into the mobile space.
Although there are several different frameworks out there that can be used such as jQuery Mobile, Sencha Touch, jQTouch, and others, how do you test how your site renders on iOS, Android, Blackberry, Windows Phone, and the variety of mobile form factors out there? Although there are different virtual solutions that can be used including Electric Plum for iOS, emulators, browser plugins for resizing the laptop/desktop browser, and more, at some point you need to test on as many physical devices as possible. This can be extremely challenging and quite time consuming though especially when you consider that you have to manually enter URLs into devices and click links on each one to drill-down into sites.
Adobe Labs just released a product called Adobe Shadow (thanks to Kurt Sprinzl for letting me know about it) that significantly simplifies testing sites on physical devices, debugging problems you find, and even making live modifications to HTML and CSS content while viewing a site on the device to see how rendering changes. You can view a page in your laptop/desktop browser and have it automatically pushed to all of your devices without actually touching the device (a huge time saver). See a problem with a device? Locate it using the free Chrome extension, pull up inspection tools (based on the Chrome Developer tools) and make live changes through Chrome that appear on the respective device so that it’s easy to identify how problems can be resolved. I’ve been using Adobe Shadow and am very impressed with the amount of time saved and the different features that it offers. In the rest of the post I’ll walk through how to get it installed, get it started, and use it to view and debug pages.
Getting Adobe Shadow Installed
The following steps can be used to get Adobe Shadow installed:
1. Download and install Adobe Shadow on your laptop/desktop
2. Install the Adobe Shadow extension for Chrome
3. Install the Adobe Shadow app on all of your devices (you can find it in various app stores)
4. Connect your devices to Wifi. Make sure they’re on the same network that your laptop/desktop machine is on
Getting Adobe Shadow Started
Once Adobe Shadow is installed, you’ll need to get it running on your laptop/desktop and on all your mobile devices. The following steps walk through that process:
1. Start the Adobe Shadow application on your laptop/desktop
2. Start the Adobe Shadow app on each of your mobile devices
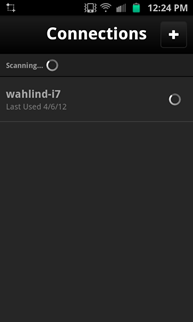
3. Locate the laptop/desktop name in the list that’s shown on each mobile device:
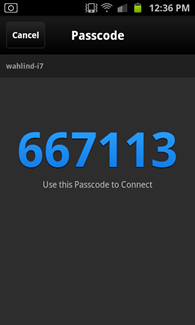
4. Select the laptop/desktop name and a passcode will be shown:
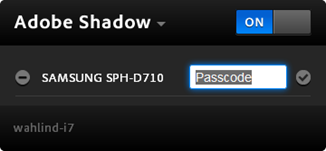
5. Open the Adobe Shadow Chrome extension on the laptop/desktop and enter the passcode for the given device:
Using Adobe Shadow to View and Modify Pages
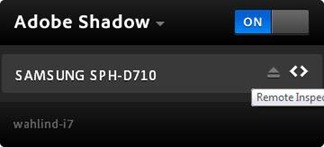
Once Adobe Shadow is up and running on your laptop/desktop and on all of your mobile devices you can navigate to a page in Chrome on the laptop/desktop and it will automatically be pushed out to all connected mobile devices. If you have 5 mobile devices setup they’ll all navigate to the page displayed in Chrome (pretty awesome!). This makes it super easy to see how a given page looks on your iPad, Android device, etc. without having to touch the device itself. If you find a problem with a page on a device you can select the device in the Chrome Adobe Shadow extension on your laptop/desktop and select the remote inspector icon (it’s the < > icon):
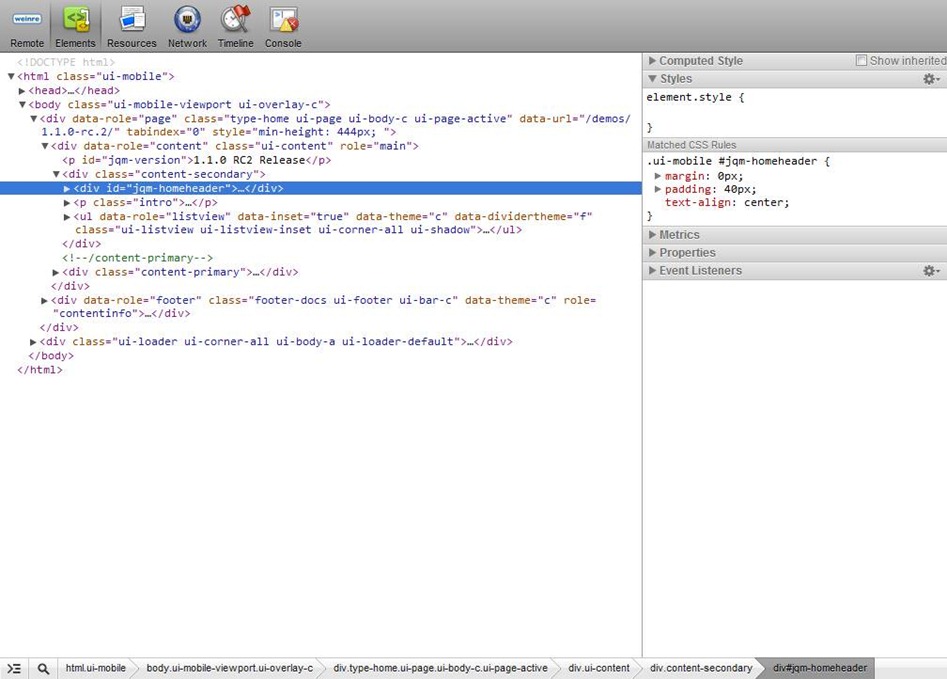
This will pull up the Adobe Shadow remote debugging window which contains the standard Chrome Developer tool tabs such as Elements, Resources, Network, etc. Click on the Elements tab to see the HTML rendered for the target device and then drill into the respective HTML content, CSS styles, etc.
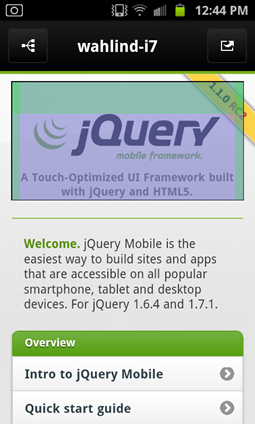
As HTML elements are selected in the Adobe Shadow debugging tool they’ll be highlighted on the device itself just like they would if you were debugging a page directly in Chrome with the developer tools. Here’s an example from my Android device that shows how the page looks on the device as I select different HTML elements on the laptop/desktop:
Conclusion
I’m really impressed with what I’ve to this point from Adobe Shadow. Controlling pages that display on devices directly from my laptop/desktop is a big time saver and the ability to remotely see changes made through the Chrome Developer Tools (on my laptop/desktop) really pushes the tool over the top. If you’re developing mobile applications it’s definitely something to check out. It’s currently free to download and use. For additional details check out the video below:
Subscribe to my Free FlipBoard Magazines: | ||||
 |  |  |  |  |

