New Line of Business Features in Silverlight 5–Debugging Bindings in XAML
This is the third post in a series covering new line of business features in Silverlight 5.
- Implicit Data Templates
- Ancestor RelativeSource Binding
- Debugging Bindings in XAML
- Elevated Trust Enhancements
- Using pInvoke
- Running with Elevated Trust In-Browser
- Creating Multiple Windows in Out-of-Browser Applications
- Vector Printing
- Custom Markup Extensions
In this post I’ll provide an overview of how data binding statements can be debugged directly in XAML.
Debugging Bindings in XAML
Line of business applications often have a lot of data binding expressions defined in XAML that handle binding object properties to control properties using one or two-way binding modes. While Silverlight's XAML data binding story is excellent, the same can't be said for debugging XAML data binding expressions in Visual Studio with Silverlight 4 and earlier. Unless you knew how to leverage Visual Studio's Output window well, you often felt like you were finding a needle in a haystack when trying to get to the bottom of a data binding problem.
Silverlight 5 and Visual Studio 2010 (with SP1) provide integrated XAML debugging support to greatly simplify the process of finding data binding issues. Simply set a breakpoint on your data binding statement in the XAML file and it'll be hit at runtime. You have full access to the important debugging windows such as Watch, Autos, and Locals. Here’s an example of setting a XAML breakpoint in Visual Studio.
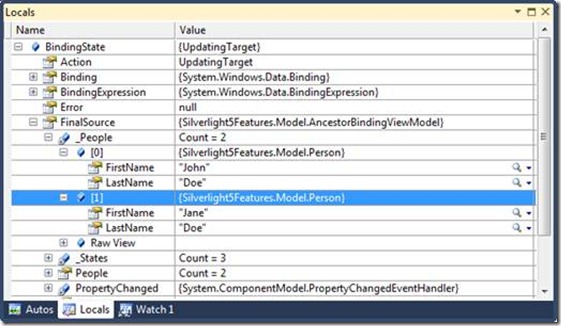
Once the breakpoint is hit you can get to windows such as the Locals window:
Looking at the Locals window you’ll see that the BindingState field has an Action property value set to UpdatingTarget which means that the target control is being updated. The Action property changes to UpdatingSource when a value is moving between a control and a source object as with a two-way binding. Drilling-down into the BindingState object you’ll also see a FinalSource property that shows the data that’s being bound to the target control. In this example two Person objects are being bound to a ListBox control. In addition to the Action and FinalSource properties, the Error property is available as well as the source object property (People in this example) participating in the data binding operation.
This new debugging functionality provides a huge productivity boost to developers trying to resolve data binding issues in their Silverlight applications. The days of scrolling through the Output window to see why a data binding expression is failing are over. There’s more that can be discussed here, but this should give you a good jumpstart on the topic if you haven’t tried it out yet.
Subscribe to my Free FlipBoard Magazines: | ||||
 |  |  |  |  |


