IIS 7 Compression. Good? Bad? How much?
If you haven't properly utilized compression in IIS, you're missing out on a lot! Compression is a trade-off of CPU for Bandwidth. With the expense of bandwidth and relative abundance of CPU, it's an easy trade-off. Yet, are you sure that your server is tuned optimally? I wasn't, which is why I finally sat down to find out for sure. I'll share the findings here.
A few years ago I wrote about compression on IIS 6. With IIS 6, the Microsoft defaults were a long ways off of the optimum settings, and a number of changes were necessary before IIS Compression worked well. My goal here is to dig deep into IIS 7 compression and find out the impact that the various compression levels have, and to see how much adjusting is needed to finely tune a Windows web server.
Note: If you don't care about all the details, jump right down to the conclusion. I've made sure to put the key review information there.
What's my purpose here?
To find out the bandwidth savings for the different compression levels, contrast them against the performance impact on the system and come up with a recommended configuration.
Understanding IIS 7 and its Differences from IIS 6
IIS 6 allowed compression per extension type (i.e. aspx, html, txt, etc) and allowed it to be turned on and off per site, folder or file. Making changes wasn't easy to do, but it was possible with a bit of scripting or editing of the metabase file directly.
IIS 7 changes this somewhat. Instead of compression per extension, it's per mime type. Additionally, it's easier to enable or disable compression per server/site/folder/file in IIS 7. It's configurable from IIS Manager, Appcmd.exe, web.config and all programming APIs.
Additionally, IIS 7 gives the ability to have compression automatically stopped when the CPU on the server is above a set threshold. This means that when CPU is freely available, compression will be applied, but when CPU isn't available, it is temporarily disabled so that it won't overburden the server. Thanks IIS team! These settings are easily configurable, which I'll cover more in a future blog post.
Both IIS6 and IIS7 allow 11 levels of compression (actually 'Off' and 10 levels of 'On'). The goal for this post is to compare the various levels and see the impact of each.
Objectives and Rules
The first thing I had to do was determine what tests I wanted to run, and how I could achieve them. I also wanted to ensure that I could clearly see the differences between the various levels. Here are some key objectives that I set for myself:
- Various file sizes: All tests had to be applied to various sizes of files. I initially tested using the default IIS7 homepage (689bytes), a 4kb file, a 28kb file and a 516kb file. I figured that would give a good range of common file sizes.
As it turned out, part way through I discovered that performance is severely affected on files of about 200kb and greater, so I did another series of tests on 100kb, 200kb, 400kb and 800kb files.
- Test compression only: It was important to me that compression was the only factor and that other variables didn't cloud the picture. For that reason, all of my test pages generate almost no CPU on their own. Almost all of the CPU increases in my tests are from compression only.
- Compression ratio: I used Port 80 Software's free online web tool to get the compression amount.
- Stress Testing: I used Microsoft's free WCAT tool. For the heavy load testing I used two WCAT client servers so that I can test the IIS server to the limit. One client couldn't quite bring the IIS server to 100% CPU.
- Baseline Transactions per Second: After testing for a while, I realized that the most useful data was with a fixed trans/sec goal. Otherwise, if I tested with a virtually instant page and thousands of transactions per second, the compression resource usage is unrealistic and the data confusing. Very few real-life IIS servers handle thousands of very-fast pages per second. So, to make the numbers more useful, I added a 125ms delay to each page so that my server could serve up 120trans/sec with 0% CPU when compression is turned off.
- Compression at all CPU Levels: I had to turn off the CPU roll-off so that all pages are compressed, even at 100% CPU. IIS 7's default setting of CPU roll-off is great, but it gets in the way of this testing.
- Solid Computer: Since compression is CPU bound, it's important that the server isn't a dinosaur. The test server is a Dell M600 with a Quad Core Intel Xeon processor (E5405 @ 2.00Ghz). The server only has 1GB of RAM but the physical memory was never used up for these tests, so it had all the memory that it needed. The disks are SAS, 10K RPM in a RAID 1 configuration.
I'll include the raw data at the bottom of the post for anyone that is interested.
Let's take a look at the results.
Compression Levels

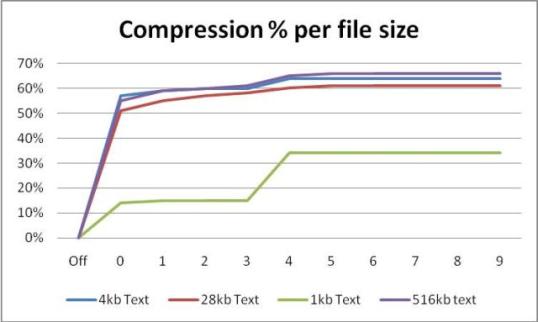
As shown in the graph here, the largest increase was between compression level 3 and 4. After that, the compression improvements were very gradual. However, if you check out the raw data below though, every level offered at least some incremental benefit.
Time to First Byte
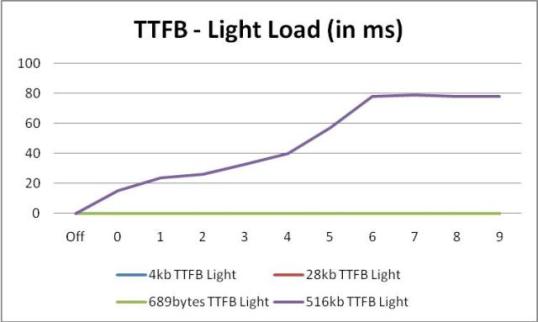
Here's a fun test I've always wanted to do, but never got around to it. I was curious how quickly a compressed vs. a non-compressed page would load under minimal server load. In other words, if there is plenty of CPU to spare, does a compressed page load at near line-speed? While both Time to First Byte (TTFB)--when the page starts to load--and Time to Last Byte (TTLB)--when the page finishes loading--are valuable, I felt that the TTFB gave the picture that I needed.

As you can see, all but the 516kb came in at about 0 milliseconds, even compressed. Note that the 28kb and 4kb lines are hidden behind the 689 bytes line. Even the 516kb file came in at under 80ms. What's 80ms?? That's very low unless you have a really busy site. As far as I'm concerned from this data, even a 516kb file loads at line speed as long as the server isn't bogged down.
Let's think about the 80ms a bit more. Dynamic pages, database calls and other factors play a much bigger role. Plus, the <80ms saves over 300kb on the page transfer, which is a savings of 2.34 seconds on a 1Mbps line! (Calculation based on: 300kbytes savings. A 1Mbps line will transfer 1024Kbps/8 = 128KB per second. 300/128KB/s = 2.34 seconds)
All of the smaller pages load almost instantly, so the impression that the end user gets from a non-pegged server is going to be better with compression on. Note that my testing doesn't take Internet latency and limits into account. So, as long as the server can compress it at near line speed, it's going to benefit the site visitor all the more.
CPU Perspective
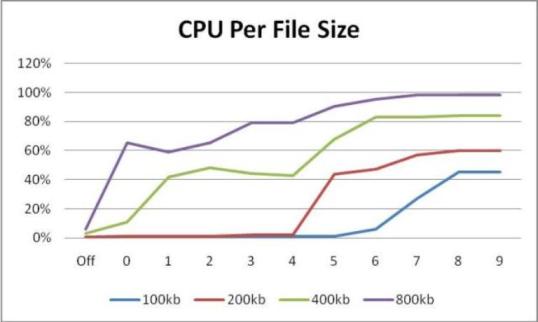
The following two charts are from a second round of testing that I did, so the file sizes are different than in the previous test. In my first round of testing I found that the file size makes a huge difference. With anything under 100kb, the compression overhead is almost non-existent. However, once you have file sizes of a couple hundred kb or greater, the CPU overhead is significant.
I ran the tests on 100kb, 200kb, 400kb and 800kb files. To put the size in perspective, I spent a good 10 minutes getting content from various sites to come up with 800kb of text. I used pages like this from Scott Guthrie's blog, and it still took multiple pages to collect 800kb of text. That particular page only has 145kb of text on it, but it's 440kb in size because of the HTML mark-up. So, a 400kb file isn't overly common (not many people have as many blog comments as Scott Gu), but it's certainly possible.
To obtain a good CPU chart, I had to use some trickery. I wanted to create a test where I could hit the server as hard as a heavily utilized server is hit, but somehow keep non-compression related CPU to 0. I achieved this by using System.Threading.Thread.Sleep(125) in the pages. This sets a 125ms delay that doesn't use any CPU. Then I set the WCAT thread count to 30 per server (2 WCAT client computers). This became my baseline since, with these settings, the IIS server handled 120 Transactions/second. From looking at some busy production servers here at ORCS Web, I concluded that that was a reasonable level for a busy server. The CPU load without compression was nearly zero, so I was pleased with this test case.

I found this the most interesting. Notice that each file size hit a sweet spot at a different compression level. For example, if you figure that your files are mostly 200kb and smaller, you may want to use Compression Level 4, which uses almost no CPU for a 200kb file.
This is on a Quad Core server, targeting 120 transactions/second. As you can see, if you plan to have that level of traffic on your server, and your file sizes are into the hundreds of kilobytes, you may want to watch the compression utilization on the server. It may be using more resources that you realize. I don't think most people have much to worry about though as the average page size is less than 100kb, and the load on the average server is often much less than 120 transactions/second.
I'll mention more in the conclusion, but it's worth briefly mentioning now that you should consider having different compression levels for static and dynamic content. Static content is compressed and cached, so it's only compressed once until the next time the file is changed. For that reason, you probably don't care too much about the CPU overhead and can go with a setting of 9.
On the other hand, dynamic pages are compressed every time (for the most part, although further details on cached dynamic pages can be found here). So, the setting for the dynamic compression level is much more important to understand.
This also lets us realize that it would be foolish to turn on compression just for the fun of it. Formats that don't compress much (or are already compressed) like JPG's, EXE's, ZIP's and the like, are often large and the CPU overhead to try to compress them further could be substantial. These aren't compressed by default in IIS 7.
Transactions per Second

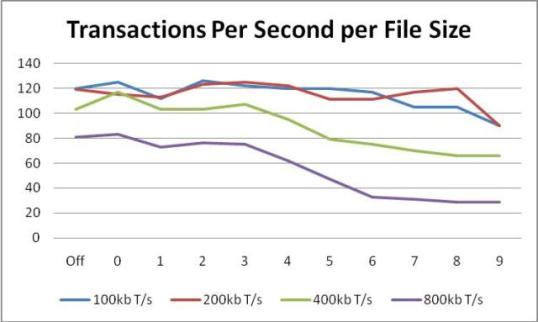
Just as a reminder, my goal was to start with 120 transactions/sec. The server could handle much more, but this was controlled so that 120 was considered the base. That was achieved with <1% CPU when non-compressed.
Notice that 100kb and 200kb files can still be served up at nearly the same rate. Once you get to 800kb file sizes though, the server spends massive computing power to compress each page. Part of that isn't just compression related. Notice that even with compression turned off, IIS could only serve up 80 Transactions/sec using the same WCAT settings. However, the transacctions/sec drops off considerably with each compression level.
Conclusion
So, what is my recommendation? Your mileage will vary, depending on the types of files that you serve up and how active your involvement in the server is.
One great feature that IIS 7 offers is the CPU roll-off. When CPU gets beyond a certain level, IIS will stop compressing pages, and when it drops below a different level, it will start up again. This is controlled by the staticCompressionEnableCpuUsage and dynamicCompressionDisableCpuUsage attributes. That in itself offers a large safety net, protecting you from any surprises.
Based on the data collected, the sweet spot seems to be compression level 4. It's between 3 and 4 that the compression benefit jumps, but it's between 4 and 5 that the resource usage jumps, making 4 a nice balance between ‘almost full compression levels' and ‘not quite as bad on resource usage'.
Since static files are only compressed once until they are changed again, it's safe to leave them at the default level of 7, or even move it all the way to 9 if you want to compress every last bit out of it. Unless you have thousands of files that aren't individually called very often, I recommend the higher the better.
For dynamic, there is a lot to consider. If you have a server that isn't CPU heavy, and you actively administer the server, then crank up the level as far as it will go. If you are worried that you'll forget about compression in the future when the server gets busier, and you want a safe setting that you can set and forget, then leave at the default of 0, or move to 4.
Make sure that you don't compress non-compressible large files like JPG, GIF, EXE, ZIP. Their native format already compresses them, and the extra attempts to compress them will use up valuable system resources, for little or no benefit.
Microsoft's default of 0 for dynamic and 7 for static is safe. Not only is it safe, it is aggressive enough to give you ‘most' of the benefit of compression with minimal system resource overhead. Don't forget that the default *does not* enable dynamic compression.
My recommendation is, first and foremost, to make sure that you haven't forgotten to enable dynamic compression. In almost all cases it's well worth it, unless bandwidth is free for you and you run your servers very hot (on CPU). Since bandwidth is so much more expensive than CPU, moving forward I'll be suggesting 4 for dynamic and 9 for static to get the best balance of compression and system utilization. At this setting, I can set and forget for the most part, although when I run into a situation when a server runs hot, I'll be sure to experiment with compression turned off to see what impact compression has in that situation.
Disclaimer: I've run these tests this last week and haven't fully burned in or tested these settings in production over time, so it's possible that my recommendation will change over time. Use the data above and use my recommendations at your own risk. That said, I feel comfortable with my recommendation for myself, if that means anything. Additionally, at ORCS Web, we've run both static and dynamic at level 9 for years and have never attributed compression as the culprit to heavy CPU on production servers. My test load of 120 transactions/sec is probably more than most production servers handle, so even 9 for both static and dynamic could be a safe setting in many situations.
The How
Here are some AppCmd.exe commands that you can use to make the changes, or to add to your build scripts. Just paste them into the command prompt and you're good to go. Watch for line breaks.
Enable Dynamic Compression, and ensure Static compression at the server level:
Alternately, apply for just a single site (make sure to update the site name):
To set the compression level, run the following (this can only be applied at the server level):
IIS 7 only sets GZip by default. If you use Deflate, run the previous command for Deflate too.
Note that when changing the compression level, an IISReset is required for it to take effect.
Data
In case the raw data interests you, I've provided it here.
Compression ratio
| Level | 400kb Text | 28kb Text | 1kb Text | 516kb text | ||||
| Size | % | Size | % | Size | % | Size | % | |
| Off | 3904 | 0% | 28274 | 0% | 689 | 0% | 528834 | 0% |
| 0 | 1713 | 57% | 13878 | 51% | 594 | 14% | 238630 | 55% |
| 1 | 1636 | 59% | 12825 | 55% | 588 | 15% | 221751 | 59% |
| 2 | 1597 | 60% | 12342 | 57% | 587 | 15% | 213669 | 60% |
| 3 | 1592 | 60% | 11988 | 58% | 587 | 15% | 206795 | 61% |
| 4 | 1434 | 64% | 11400 | 60% | 457 | 34% | 190362 | 65% |
| 5 | 1428 | 64% | 11228 | 61% | 457 | 34% | 184649 | 66% |
| 6 | 1428 | 64% | 11158 | 61% | 457 | 34% | 181087 | 66% |
| 7 | 1428 | 64% | 11151 | 61% | 457 | 34% | 180620 | 66% |
| 8 | 1428 | 64% | 11150 | 61% | 457 | 34% | 180485 | 66% |
| 9 | 1428 | 64% | 11150 | 61% | 457 | 34% | 180481 | 66% |
CPU Usage per Compression Level
| Level | 100kb | 200kb | 400kb | 800kb | ||||
| CPU | T/sec | CPU | T/sec | CPU | T/sec | CPU | T/sec | |
| Off | 1% | 120 | 1% | 119 | 3% | 103 | 6% | 81 |
| 0 | 1% | 125 | 1% | 115 | 11% | 117 | 65% | 83 |
| 1 | 1% | 112 | 1% | 113 | 42% | 103 | 59% | 73 |
| 2 | 1% | 126 | 1% | 123 | 48% | 103 | 65% | 76 |
| 3 | 1% | 122 | 2% | 125 | 44% | 107 | 79% | 75 |
| 4 | 1% | 120 | 2% | 122 | 43% | 95 | 79% | 62 |
| 5 | 1% | 120 | 44% | 111 | 68% | 79 | 90% | 47 |
| 6 | 6% | 117 | 47% | 111 | 83% | 75 | 95% | 33 |
| 7 | 27% | 105 | 57% | 117 | 83% | 70 | 98% | 31 |
| 8 | 45% | 105 | 60% | 120 | 84% | 66 | 98% | 29 |
| 9 | 45% | 90 | 60% | 90 | 84% | 66 | 98% | 29 |
Time to First Byte (TTFB) - minimal load. In milliseconds.
| Level | 4kb | 28kb | 689bytes | 516kb |
| Off | 0 | 0 | 0 | 0 |
| 0 | 0 | 0 | 0 | 15 |
| 1 | 0 | 0 | 0 | 24 |
| 2 | 0 | 0 | 0 | 26 |
| 3 | 0 | 0 | 0 | 33 |
| 4 | 0 | 0 | 0 | 40 |
| 5 | 0 | 0 | 0 | 57 |
| 6 | 0 | 0 | 0 | 78 |
| 7 | 0 | 0 | 0 | 79 |
| 8 | 0 | 0 | 0 | 78 |
| 9 | 0 | 0 | 0 | 78 |