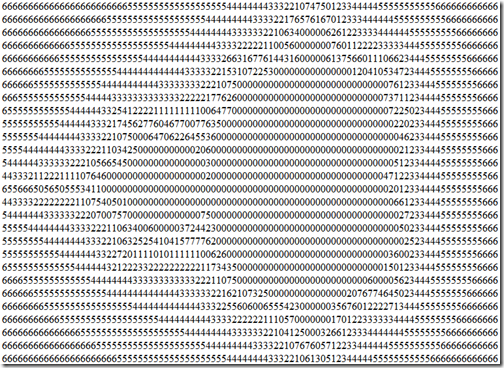
Mandelbrot set in a twitcode
Kinik just published a pretty amazing #twitcode version of a Mandelbrot set visualization in JavaScript that Jacob Seidelin wrote.
Here’s the code:
for(k=84;k-=1/32;document.write(k%3?i%8:'<br/>'))
for(x=y=0,i=99;--i/y;x=t)t=x*x-y*y+1-k%3,y=1-k/42+y*x*2
And here’s what it renders:
