Debugging SharePoint/ASP.NET code? Smart key-codes + disable timeout!
I'm currently running around in the Visual Studio debugger to debug some complex SharePoint code. There are two things really annoy me: all the mouse-clicks needed to attach to the Internet Information Server process and the time-out you get when you are exploring complex data-structures for too long.
First my favorite key-sequence for the last week: <ALT-D>PW3<ENTER><ENTER>. I will explain it:
<Alt-D> brings up the debugging menu in Visual Studio:
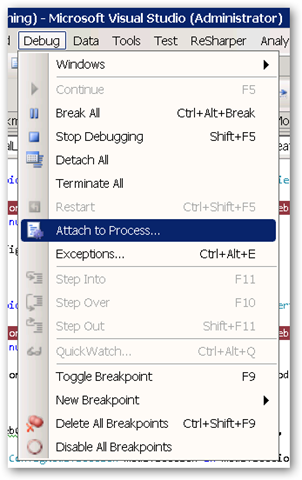
With P the action "Attach to Process..." is executed, which brings you to the following window:
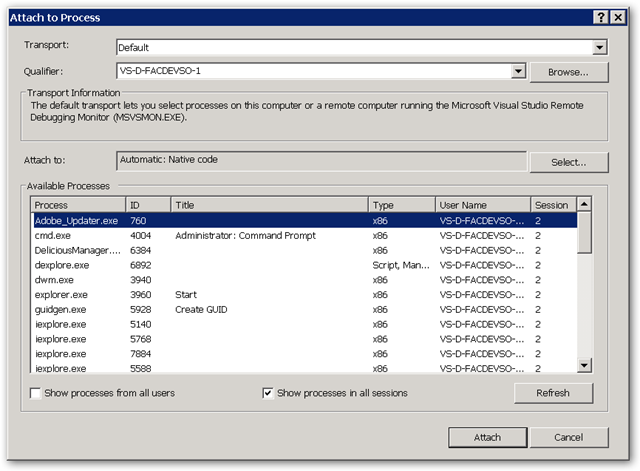
The list of available processes is already active. We nog need to select the Internet Information Server worker process. Each application pool has it's own worker process. These worker processes are named: w3wp.exe.
By typing W3 the first (and often only) w3wp.exe process is selected:
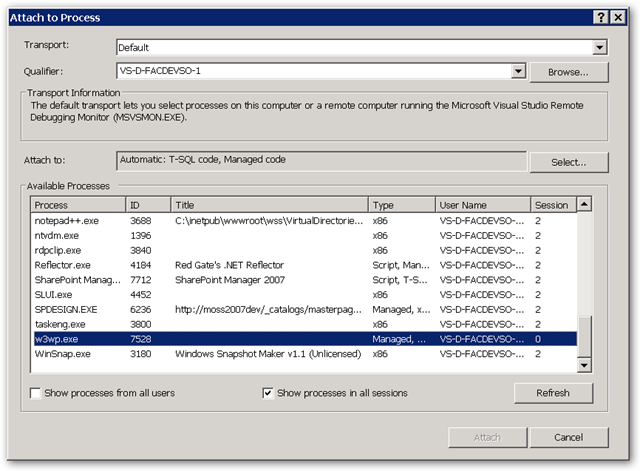
If there are multiple w3wp.exe processes you could select them all (SHIFT+ARROWDOWN). Now press the first time <ENTER>, which selects the w3wp.exe process(es). This results in the following window:
The "Attach" button is selected by default. This brings us to the latest <ENTER> to accept the default selection.
We are now attached to the correct Internet Information Server working process(es) and can start debugging.
Just try it a few times: <ALT-D>PW3<ENTER><ENTER>, it will become second nature in no time. Happy debugging....
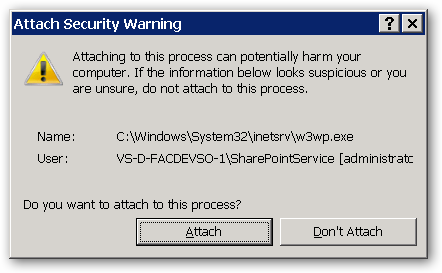
... until you get the following popup window:

You have got a "ping" timeout. If you read the box well, it tells you exactly what happened, and it tells you to press the "Help" button for further details.
Most people don't read the box, and start over again. But it worth the effort to follow the described steps from the Microsoft documentation, they are a bit hard to follow:
To continue to debug, you must configure IIS to allow the worker process to continue.
To enable Terminal Services (?? Terminal Services ??)
-
Open the Administrative Tools window.
-
Click Start, and then choose Control Panel.
-
In Control Panel, choose Switch to Classic View, if necessary, and then double-click Administrative Tools.
-
In the Administrative Tools window, double-click Internet Information Services (IIS) Manager.
-
In the Internet Information Services (IIS) Manager window, expand the <computer name> node.
-
Under the <computer name> node, right-click Application Pools.
-
In the Application Pools list, right-click the name of the pool your application runs in, and then click Advanced Settings.
-
In the Advanced Settings dialog box, locate the Process Model section and choose one of the following actions:
-
Set Ping Enabled to False.
-or-
-
Set Ping Maximum Response Time to a value greater than 90 seconds.
Setting Ping Enabled to False stops IIS from checking whether the worker process is still running and keeps the worker process alive until you stop your debugged process. Setting Ping Maximum Response Time to a large value allows IIS to continue monitoring the worker process.
-
-
Click OK.
-
Under Services and Applications, click Services. -- Don't know what the rest of the steps if for... you are done!
A list of services appears in the right-side pane.
-
In the Services list, right-click Terminal Services, and then click Properties.
-
In the Terminal Services Properties window, locate the General tab and set Startup type to Manual.
-
Click OK to close the Advanced Settings dialog box.
-
Close the Internet Information Services (IIS) Manager window and the Administrative Tools window.
I'm running on Windows Server 2008, and below are the steps that I follow:
Just type iis in the Start Search box, this shows me two applications:
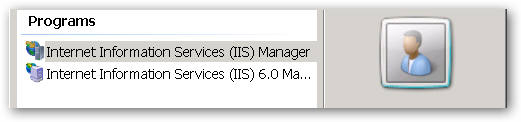
I take the top one (I'm not running under IIS 6) and get the following screen:
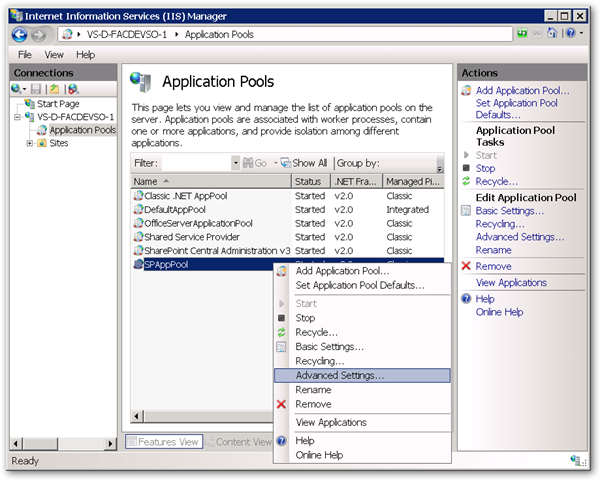
Right-click your application pool, advanced settings... and you get the following screen:
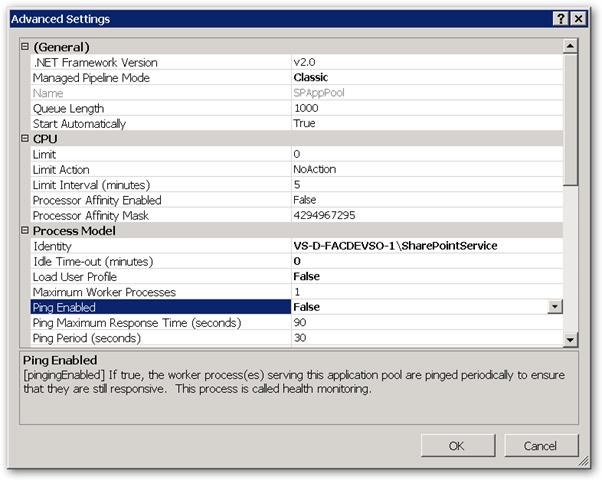
Set "Ping Enabled" to False, press OK, and you can drill through your data-structures in the debugger for as long as you want!
Again: "Happy debugging!"